The Coppock Curve (CC) was introduced by economist Edwin Coppock in Barron's, October 1962. While useful, the indicator isn't a commonly discussed amongst traders and investors. Traditionally used to spot long-term trend changes in major stock indexes, traders can use the indicator on any time and in any market to isolate potential trend shifts and generate trade signals.
Coppock Curve
Coppock initially developed the indicator for long-term monthly charts; this will appeal to long-term investors as signals are quite infrequent on this time frame. Drop down to a weekly, daily or hourly time and the signals become progressively more abundant.
The indicator is derived by taking a weighted moving average of the rate-of-change (ROC) of a market index such as the S&P 500, or trading equivalent such as the S&P 500 SPDR ETF (ARCA:SPY). Simply put, it is a momentum indicator that oscillates above and below zero.
There are three variables within the indicator: the Short ROC Period and Long ROC Period are generally set at 11 and 14, respectively; the WMA (weighted moving average) is typically set at 10. The Period indicates how many price bars are used in the indicator's calculation. Coppock preferred monthly price bars, but traders can use any size price bars, including 1-minute, hourly, daily, and so on.
Coppock came up with 11 and 14 periods for the ROC part of the calculation after being told by Episcopal bishops that the average person's mourning period is 11 to 14 months. Coppock inferred a downtrend was like a mourning period, so he used these figures.
The Coppock Curve is calculated as a 10-month weighted moving average of the sum of the 14-month rate of change and the 11-month rate of change for the index.
For those mathematically inclined the formula is:
Coppock Curve = 10-period WMA of 14-period ROC + 11-perod ROC
Where the ROC is:
ROC = [(Close - Close n periods ago) / (Close n periods ago)] * 100
And where "n" is the number of periods used in the calculation--in this case, 11 and 14 (two separate ROC calculations).
Coppock Curve Strategy
The zero line of the Coppock Curve acts as a trade trigger; buy when the CC moves above zero and sell when the CC moves below zero. Investors can use the sell signal to close out their long positions and then re-initiate long positions when CC crosses back above zero.Traders who wish to be more active can close out longs and imitate short trades when the CC crosses below zero.
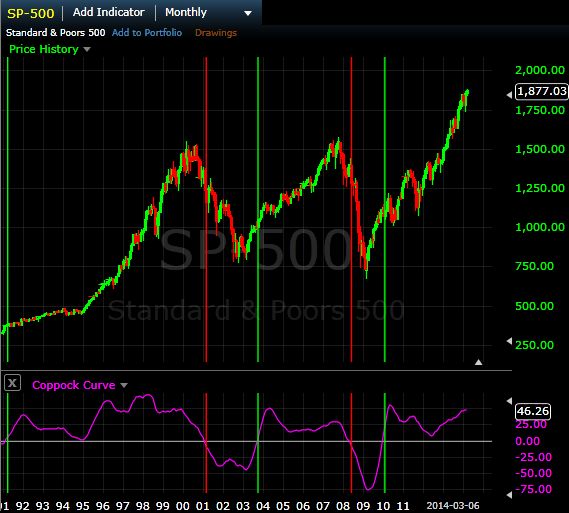
Figure 1 shows the basic strategy applied to a monthly chart of the S&P 500 index. A buy signal was generated in 1991 followed by sell signal in 2001. This would have allowed the investor to avoid much of the decline in the rest of 2001 and 2002. A buy signal was generated in 2003 with a signal to sell in 2008. The indicator would have again saved the investor from the rest of the decline in 2008 and early 2009. Another buy signal was generated in early 2010 and that position remains open until the CC moves below zero.
Figure 1. S&P 500 Monthly Chart with Coppock Curve

Fig1
Source: Freestockcharts.com
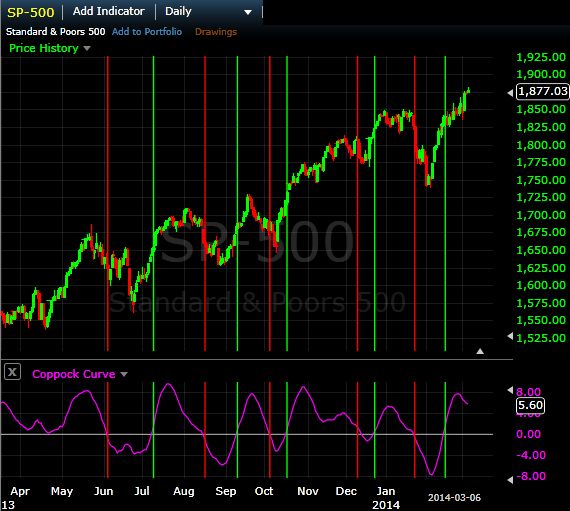
In Figure 2 the strategy is applied to a daily chart of the S&P 500. Many more signals are generated, appealing to more active traders who wish to enter and exit on each price wave.
Figure 2. S&P 500 Daily Chart with Coppock Curve Signals

Fig 2
Source: Freestockcharts.com
Adjusting Settings
While the typical indicator settings work well on monthly charts, they may not work as well on weekly or shorter time frames. In Figure 2 for example, entries and exits occur a bit too late in the move to extract much of a profit from the price waves and would result in losses on a number of trades.
Decreasing the rate-of-change variables will increase the speed of the fluctuations in the CC and increase the number of trade signals. Increasing the rate-of-change variable will the slow the fluctuations and produce fewer signals.
If you wish to receive earlier entry and exit signals, decrease the WMA. The number of trade signals may increase with this adjustment as well. To wait for more confirmation and receive later entry and exits signals, increase the WMA; this may also decrease the number of trade signals.
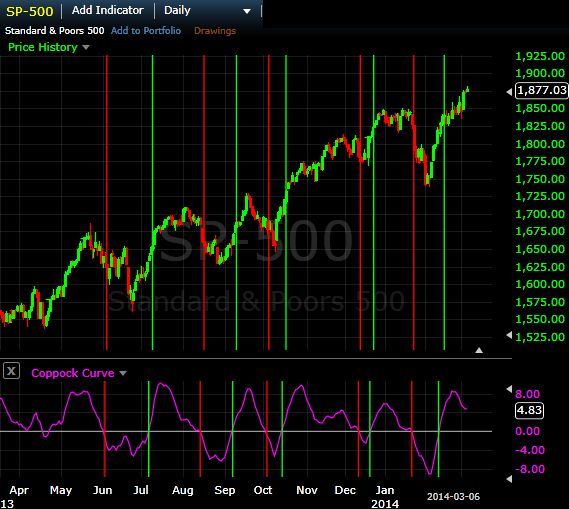
By decreasing the WMA to 6 (instead of 10), entries occur a bit earlier in the up moves, and exits (and potential short trades) occur a bit earlier in the down moves. In Figure 3, the vertical lines on the price portion of the chart reflect entires and exits based on typical settings (14,11,10), while the vertical lines on the Coppock Curve portion of the chart reflect entries and exits based on adjusted settings (14,11,6). The adjusted settings shift the entries and exits slightly to the left; such adjustments can have a large impact on profitability or losses.
The adjusted settings also created a new buy and sell signal in April 2014, which is not marked on the chart.
Figure 3. S&P 500 Daily Chart with Adjusted Coppock Curve Settings

Fig 3
Source: Freestockcharts.com
Filtering Trades
Active traders may wish to only take trade signals in the same direction as the dominant trend, as this is where most of the profits lie. On a longer-term chart, note the trending direction. If trading on a daily time frame, the longer-term chart would be a weekly. If the Coppock Curve is above zero on the weekly, only take long trades on the daily chart. Sell when a sell signal occurs, but don't take short trades because this would be against the dominant trend.
If the dominant trend is down, take only short trades on the shorter time frame. Exit short positions when a buy signals occurs, but don't establish a long position as this would be against the dominant downtrend.
Adjust the settings of the indicator on both time frames to create the number of trade signals you are comfortable with.
Considerations
When price is moving in a choppy fashion, especially on smaller time frames, multiple signals can be generated resulting in numerous very short-term, and potentially unprofitable, trades. The indicator is best applied to trending markets, which is why establishing a dominant trend on a longer time frame can help filter some potentially poor trades on lower time frames.
The strategy does not include a stop loss to cap the risk on each trade, but traders are encouraged to implement their own stop loss to avoid excessive risk. When initiating a long position a stop can be placed below the recent swing low in price, and when initiating a short position a stop can be placed above a recent swing high in price.
In Summary
The Coppock Curve is a momentum oscillator originally designed to point out shifts in the long-term trend of stock indexes. It does a good job of pointing out these trend changes on the monthly chart. Shorter-term traders can also use the indicator, and some adjustment to the settings may be required on these shorter time frames. Traders are encouraged to test out the strategy on their own markets and time frames, and make appropriate setting adjustments, before implementing the strategy in the live market.
Cory Mitchell can be contacted at Vantage Point Trading
Coppock Curve
Coppock initially developed the indicator for long-term monthly charts; this will appeal to long-term investors as signals are quite infrequent on this time frame. Drop down to a weekly, daily or hourly time and the signals become progressively more abundant.
The indicator is derived by taking a weighted moving average of the rate-of-change (ROC) of a market index such as the S&P 500, or trading equivalent such as the S&P 500 SPDR ETF (ARCA:SPY). Simply put, it is a momentum indicator that oscillates above and below zero.
There are three variables within the indicator: the Short ROC Period and Long ROC Period are generally set at 11 and 14, respectively; the WMA (weighted moving average) is typically set at 10. The Period indicates how many price bars are used in the indicator's calculation. Coppock preferred monthly price bars, but traders can use any size price bars, including 1-minute, hourly, daily, and so on.
Coppock came up with 11 and 14 periods for the ROC part of the calculation after being told by Episcopal bishops that the average person's mourning period is 11 to 14 months. Coppock inferred a downtrend was like a mourning period, so he used these figures.
The Coppock Curve is calculated as a 10-month weighted moving average of the sum of the 14-month rate of change and the 11-month rate of change for the index.
For those mathematically inclined the formula is:
Coppock Curve = 10-period WMA of 14-period ROC + 11-perod ROC
Where the ROC is:
ROC = [(Close - Close n periods ago) / (Close n periods ago)] * 100
And where "n" is the number of periods used in the calculation--in this case, 11 and 14 (two separate ROC calculations).
Coppock Curve Strategy
The zero line of the Coppock Curve acts as a trade trigger; buy when the CC moves above zero and sell when the CC moves below zero. Investors can use the sell signal to close out their long positions and then re-initiate long positions when CC crosses back above zero.Traders who wish to be more active can close out longs and imitate short trades when the CC crosses below zero.
Figure 1 shows the basic strategy applied to a monthly chart of the S&P 500 index. A buy signal was generated in 1991 followed by sell signal in 2001. This would have allowed the investor to avoid much of the decline in the rest of 2001 and 2002. A buy signal was generated in 2003 with a signal to sell in 2008. The indicator would have again saved the investor from the rest of the decline in 2008 and early 2009. Another buy signal was generated in early 2010 and that position remains open until the CC moves below zero.
Figure 1. S&P 500 Monthly Chart with Coppock Curve

Fig1
Source: Freestockcharts.com
In Figure 2 the strategy is applied to a daily chart of the S&P 500. Many more signals are generated, appealing to more active traders who wish to enter and exit on each price wave.
Figure 2. S&P 500 Daily Chart with Coppock Curve Signals

Fig 2
Source: Freestockcharts.com
Adjusting Settings
While the typical indicator settings work well on monthly charts, they may not work as well on weekly or shorter time frames. In Figure 2 for example, entries and exits occur a bit too late in the move to extract much of a profit from the price waves and would result in losses on a number of trades.
Decreasing the rate-of-change variables will increase the speed of the fluctuations in the CC and increase the number of trade signals. Increasing the rate-of-change variable will the slow the fluctuations and produce fewer signals.
If you wish to receive earlier entry and exit signals, decrease the WMA. The number of trade signals may increase with this adjustment as well. To wait for more confirmation and receive later entry and exits signals, increase the WMA; this may also decrease the number of trade signals.
By decreasing the WMA to 6 (instead of 10), entries occur a bit earlier in the up moves, and exits (and potential short trades) occur a bit earlier in the down moves. In Figure 3, the vertical lines on the price portion of the chart reflect entires and exits based on typical settings (14,11,10), while the vertical lines on the Coppock Curve portion of the chart reflect entries and exits based on adjusted settings (14,11,6). The adjusted settings shift the entries and exits slightly to the left; such adjustments can have a large impact on profitability or losses.
The adjusted settings also created a new buy and sell signal in April 2014, which is not marked on the chart.
Figure 3. S&P 500 Daily Chart with Adjusted Coppock Curve Settings

Fig 3
Source: Freestockcharts.com
Filtering Trades
Active traders may wish to only take trade signals in the same direction as the dominant trend, as this is where most of the profits lie. On a longer-term chart, note the trending direction. If trading on a daily time frame, the longer-term chart would be a weekly. If the Coppock Curve is above zero on the weekly, only take long trades on the daily chart. Sell when a sell signal occurs, but don't take short trades because this would be against the dominant trend.
If the dominant trend is down, take only short trades on the shorter time frame. Exit short positions when a buy signals occurs, but don't establish a long position as this would be against the dominant downtrend.
Adjust the settings of the indicator on both time frames to create the number of trade signals you are comfortable with.
Considerations
When price is moving in a choppy fashion, especially on smaller time frames, multiple signals can be generated resulting in numerous very short-term, and potentially unprofitable, trades. The indicator is best applied to trending markets, which is why establishing a dominant trend on a longer time frame can help filter some potentially poor trades on lower time frames.
The strategy does not include a stop loss to cap the risk on each trade, but traders are encouraged to implement their own stop loss to avoid excessive risk. When initiating a long position a stop can be placed below the recent swing low in price, and when initiating a short position a stop can be placed above a recent swing high in price.
In Summary
The Coppock Curve is a momentum oscillator originally designed to point out shifts in the long-term trend of stock indexes. It does a good job of pointing out these trend changes on the monthly chart. Shorter-term traders can also use the indicator, and some adjustment to the settings may be required on these shorter time frames. Traders are encouraged to test out the strategy on their own markets and time frames, and make appropriate setting adjustments, before implementing the strategy in the live market.
Cory Mitchell can be contacted at Vantage Point Trading
Last edited by a moderator:
