Often, tape reading is viewed as something that held value back in the 1990s, yet I would argue that there is still value in it today, especially when it comes to options. This article will walk the readers through the process of discovering a possible trade using tape reading and then follow its evolution chronologically.
Day One: Weekly Options are Listed
Every Thursday morning weekly options are listed on a small number of ETFs (Exchange Traded Funds). On Thursday, 2/24/2011, I was considering placing a trade on the IWM (Russell 2000 tracking ETF). Figure 1 shows three TradeStation windows, the most colorful one being the Options Analysis window. The columns that one needs to focus on are Open Interest, in white, and the Volume for the individual strike prices, also in white. On Thursday when the market opened, the weekly options started trading. Filled contracts were recorded under the volume column, and then the next day that amount becomes Open Interest, or as Future traders would say, the number of outstanding contracts held either long or short. The Volume column is basically just the volume for that particular session.
Having clarified that, I must say that volume on the call side was pretty weak, with the exception of the March weekly 83 calls that had a volume of 1,062 and the 85 calls that traded exactly 1,000 contracts. Being still early in the morning, I knew that was likely to be a large institution, so I pulled up the Time & Sales window to verify the specifics. What the Time and Sales (T&S or the tape) was telling me is also shown on Figure 1.
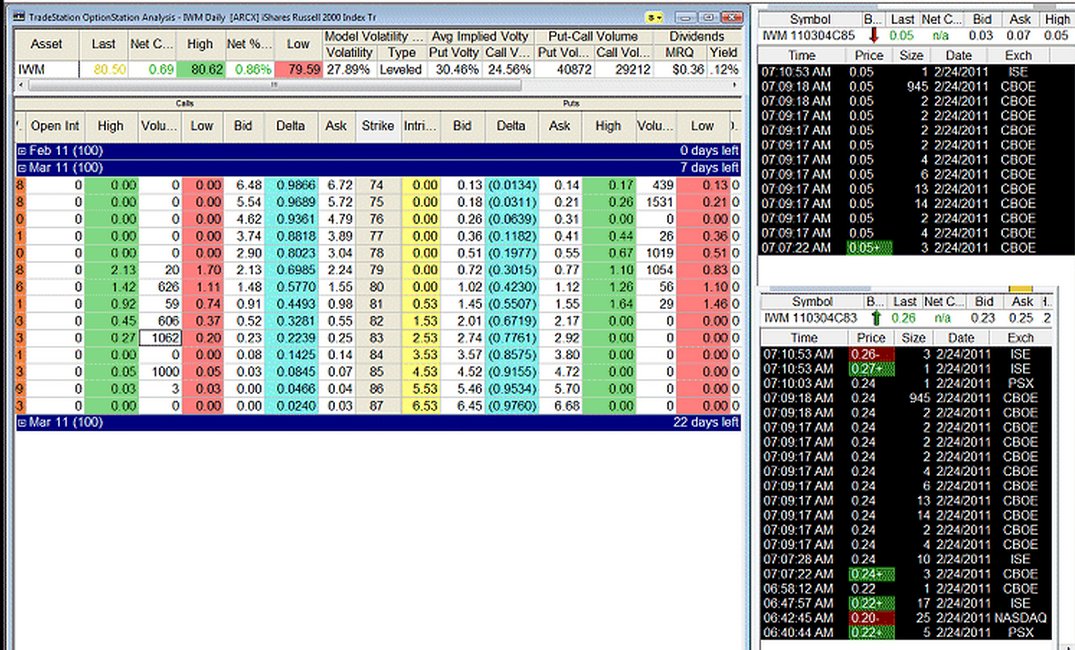
Figure 1
The top T&S is for the IWM 85 call, while the lower one is for the 83 call. Each of these two tapes lists the Time of execution, Price (meaning the premium either paid or received), Size (contract-wise), Date and Exchange.
The biggest trade on the 85 calls was at 7:09 AM (Pacific Standard Time for me living here on the West Coast) in the amount of 945 contracts. Similarly, the biggest trade on the 83 calls was also at 7:09 AM in the same amount of 945 contracts.
I would argue that these two trades are not single legs but a part of a spread. Spreads are also known as complex orders and they all get routed to COMP-BOX. To be certain that the trade was a spread, both legs, long and short, need to be filled by the same exchange. In this case, both were filled by CBOE. Also, the timing of this trade was impeccable, for it was done right after the 7 AM reversal.
For me, it was instantly clear that the trade was likely a short vertical call. IWM was trading at $80.50 and the sold 83 call was 2.50 out of the money, and the 85, with a premium of a nickel, was purchased. Combined they produced the following:
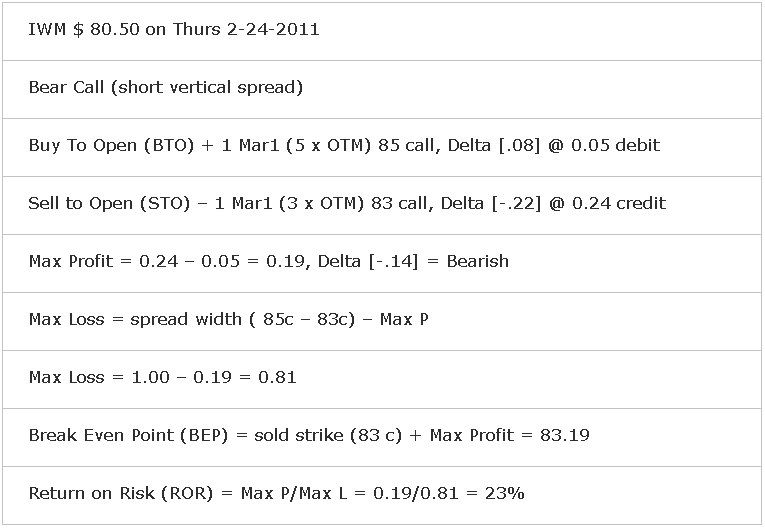
Figure 2
What needs to happen is to have IWM close below 83 at expiry on Friday 3/04/2011. Let us proceed with the chronological evolution of the trade.
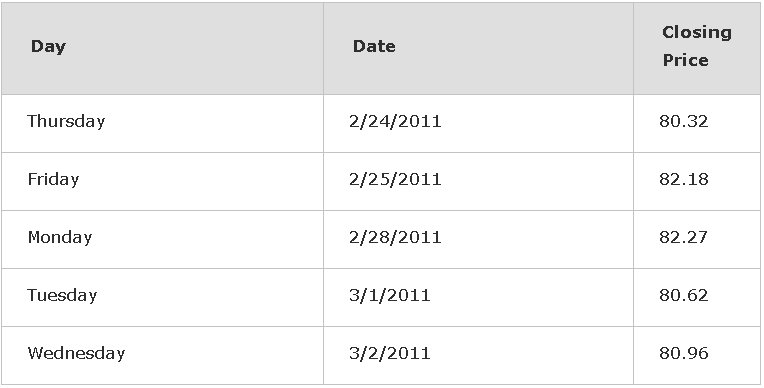
Figure 3
The sold leg is what the option seller of this spread needs to focus on, so on Thursday there was no threat. On Friday, there was an explosive move to the upside, yet still the price did not come near 83. Keep in mind, only if IWM closes above 83 would some of the profit be under attack. On Monday, IWM gapped higher but was sold off to 82.27 which was still a bit higher than the previous close. Tuesday was a big sell off day closing at 80.62, and Wed was a day of consolidation with the IWM closing slightly higher at 80.96.
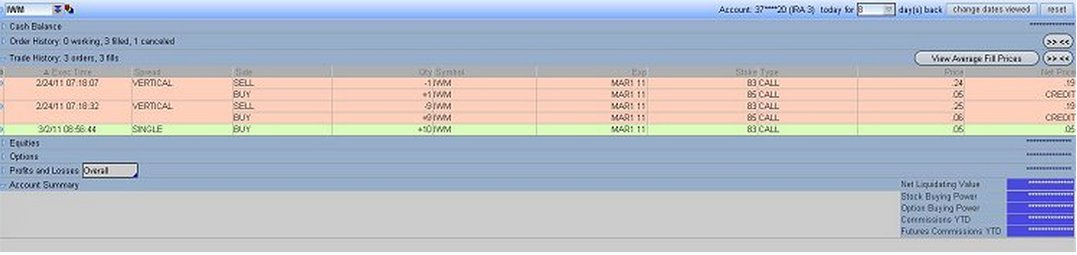
Figure 4
By the way, the figure above shows that I, too, have jumped on board of that big wave with my small 10 contracts. Once again, first the Foot soldier was sent in and then the rest of the contracts. The only reason why I am even inserting this figure is to point out that I always buy back my obligation. I covered my short 83 calls for a nickel on Wednesday. I was able to utilize that capital for another weekly option trade the next Thursday, while IWM did the following on the two remaining days of these option contracts:
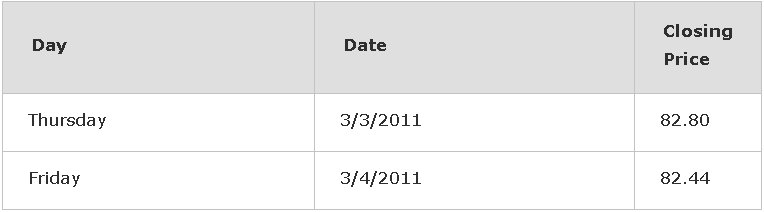
Figure 5
While this short rally up was taking place, I couldn't care less because I was no longer short. We may be able to find out by reading the tape when someone gets in, but we need to be capable enough to know when to exit ourselves.
In conclusion, the trade discussed in this article came about strictly from tape reading. It started by me looking at the open interest versus the volume of newly listed weekly options. Then as some giant footprints "poked me" in the eyes and made me curious, the entire trade became obvious to me. However, if it had not been for verifying the facts on the tape, then all of this, including the actual trade, would be just another academic and hypothetical debate with no conclusive ending. The Time and Sales, the Ticker Tape, the Print or the Tape do not lie; it lists the facts – the trades that have gone through. Use it and abuse it. Have green trading.
Day One: Weekly Options are Listed
Every Thursday morning weekly options are listed on a small number of ETFs (Exchange Traded Funds). On Thursday, 2/24/2011, I was considering placing a trade on the IWM (Russell 2000 tracking ETF). Figure 1 shows three TradeStation windows, the most colorful one being the Options Analysis window. The columns that one needs to focus on are Open Interest, in white, and the Volume for the individual strike prices, also in white. On Thursday when the market opened, the weekly options started trading. Filled contracts were recorded under the volume column, and then the next day that amount becomes Open Interest, or as Future traders would say, the number of outstanding contracts held either long or short. The Volume column is basically just the volume for that particular session.
Having clarified that, I must say that volume on the call side was pretty weak, with the exception of the March weekly 83 calls that had a volume of 1,062 and the 85 calls that traded exactly 1,000 contracts. Being still early in the morning, I knew that was likely to be a large institution, so I pulled up the Time & Sales window to verify the specifics. What the Time and Sales (T&S or the tape) was telling me is also shown on Figure 1.
Figure 1
The top T&S is for the IWM 85 call, while the lower one is for the 83 call. Each of these two tapes lists the Time of execution, Price (meaning the premium either paid or received), Size (contract-wise), Date and Exchange.
The biggest trade on the 85 calls was at 7:09 AM (Pacific Standard Time for me living here on the West Coast) in the amount of 945 contracts. Similarly, the biggest trade on the 83 calls was also at 7:09 AM in the same amount of 945 contracts.
I would argue that these two trades are not single legs but a part of a spread. Spreads are also known as complex orders and they all get routed to COMP-BOX. To be certain that the trade was a spread, both legs, long and short, need to be filled by the same exchange. In this case, both were filled by CBOE. Also, the timing of this trade was impeccable, for it was done right after the 7 AM reversal.
For me, it was instantly clear that the trade was likely a short vertical call. IWM was trading at $80.50 and the sold 83 call was 2.50 out of the money, and the 85, with a premium of a nickel, was purchased. Combined they produced the following:
Figure 2
What needs to happen is to have IWM close below 83 at expiry on Friday 3/04/2011. Let us proceed with the chronological evolution of the trade.
Figure 3
The sold leg is what the option seller of this spread needs to focus on, so on Thursday there was no threat. On Friday, there was an explosive move to the upside, yet still the price did not come near 83. Keep in mind, only if IWM closes above 83 would some of the profit be under attack. On Monday, IWM gapped higher but was sold off to 82.27 which was still a bit higher than the previous close. Tuesday was a big sell off day closing at 80.62, and Wed was a day of consolidation with the IWM closing slightly higher at 80.96.
Figure 4
By the way, the figure above shows that I, too, have jumped on board of that big wave with my small 10 contracts. Once again, first the Foot soldier was sent in and then the rest of the contracts. The only reason why I am even inserting this figure is to point out that I always buy back my obligation. I covered my short 83 calls for a nickel on Wednesday. I was able to utilize that capital for another weekly option trade the next Thursday, while IWM did the following on the two remaining days of these option contracts:
Figure 5
While this short rally up was taking place, I couldn't care less because I was no longer short. We may be able to find out by reading the tape when someone gets in, but we need to be capable enough to know when to exit ourselves.
In conclusion, the trade discussed in this article came about strictly from tape reading. It started by me looking at the open interest versus the volume of newly listed weekly options. Then as some giant footprints "poked me" in the eyes and made me curious, the entire trade became obvious to me. However, if it had not been for verifying the facts on the tape, then all of this, including the actual trade, would be just another academic and hypothetical debate with no conclusive ending. The Time and Sales, the Ticker Tape, the Print or the Tape do not lie; it lists the facts – the trades that have gone through. Use it and abuse it. Have green trading.
Last edited by a moderator: