One of the most mysterious and elusive methods of charting price action for most traders is
Japanese Candlesticks. This is one of the oldest methods of charting dating back 400 years in Japan!
This article is on a specific candle pattern called the Doji. Recognizing it is pretty straightforward. There are several Doji formations, the Dragonfly, the Gravestone and the Rickshaw. The significance behind a doji is the market price establishes a range and closes almost exactly where it opens. Give or take a tick or two in most cases. Doji's help form two and three candle formations that can develop into more powerful and trust-worthy signals once identified.
Doji's indicate indecision, the market ends where it began. Confidence is lost from buyers or sellers on the open as the market made a lot of intraday noise as the range was established. In a bullish or bearish trending market, indecision is the last thing you want to see. Strong rejection or failure from the high and or low is a significant tell-tale sign that changes are coming.
In a strong up-trending market, usually the market will close near the high as larger capitalized traders feel comfortable in holding positions overnight or in fact adding to their positions. If the large money traders are not confident the market will move higher in price, then usually the market settles back near the open.
The mystique surrounding this formation called a Doji is that it identifies a potential turning point or market reversals, especially at market tops. That is what most people understand the Doji to signify. Some experts even go as far as stating that Doji Tops should be sold no matter what. I actually disagree with that analysis and conclude while Doji's do indicate indecision, they can also signal a continuation of the current trend. The indecision that it clearly illustrates as the market closes back at the open is part of the key to understanding the potential next price move.
Imagine after a long run up in prices, a strong market would normally be identified by closing near the upper boundary of the range higher than the opening range and higher than the previous settlement.
With the Doji, the market closes back at the opening area as market participants bail out of positions from where the market opened. It is the pause or hesitation that may create longs to sell or liquidate their holdings and possibly attract short sellers. Those are the professionals who are betting the market will decline in price and that the market in effect has topped out.
However, within one or two sessions, let's say market participants decide that they reaffirm their bullish bias; this may cause a breakout and or a reversal so that the uptrend will resume. The bulls have made a stronger conviction that the market can appreciate further in value.
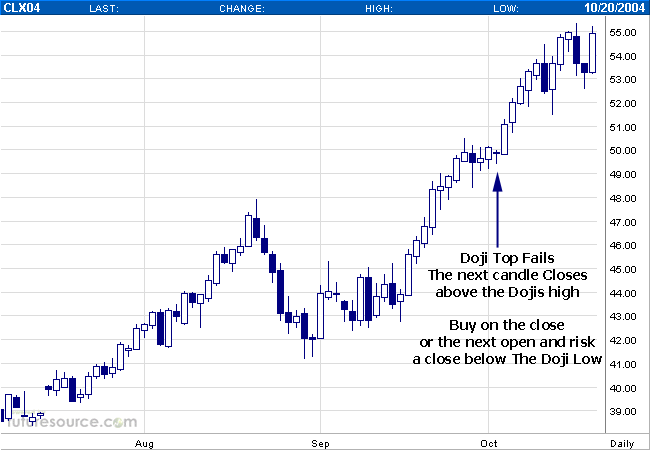
Then there are the bears or short sellers who now are on the losing end of the stick. They need to pony up more money and or get out of their short position, which requires buying into the market. That is called a short squeeze play. In the chart below we see a long uptrend and then a breakout to new highs. Then a pause and a four period session consolidation develops. Then a Doji forms. A Doji would have signaled a top but observe closely how the very next candle blasted off with a higher closing high than the Dojis high.
That is the trigger to go long, or if you are short to immediately get out of your position. If you go long, your risk is a stop close only below the Doji's low. In fact, that strategy would have worked at the bottom in late August. Also, look at the high close break out in mid-September when it closed above 45.00. It closed above the high made by the shooting star. These are the signals that the market tells us and that the candle patterns illustrate in a more visual manner.
This next chart example is of the Canadian Dollar, and as you can see, once the market started the trend higher the Doji forms, causing a one day pause in the market. The trade setup or lets say alert is that a Doji forms. However, we cannot act on this information alone.
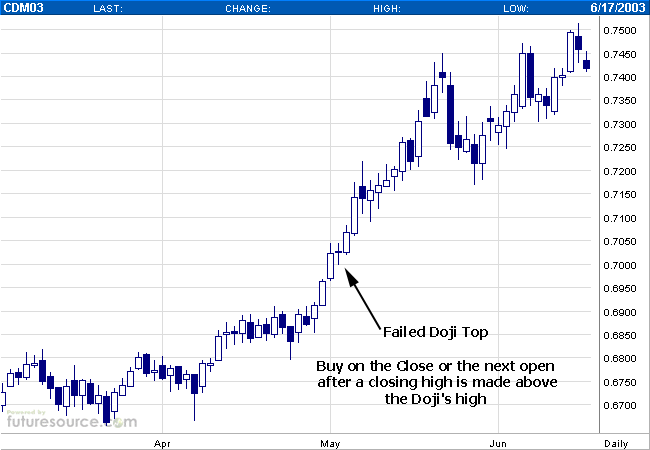
The market is telling us there is doubt. We need to wait for the true direction of the market to trigger an entry. The next session as we approach the close is the trigger. Therefore we will buy on the close as we are above the Doji's High. This is the Canadian Dollar Futures. It does trade nearly 24 hours. If you cannot get the order in on the close, certainly turn to the Globex session and buy at the market or on the open of the next session. This method works for all markets, stocks forex and futures. It is also extremely effective in different time frames. When using this method for short term trading I generally stick with the 5, 15, 30, 60 and a 200 minute chart. The later works out to a half a day time period, which I use to help me determine the short term trend.
One point I would like to mention is in liquid and active markets Doji's do not materialize often. When they do I recommend that you pay close attention and use the secrets they identify wisely. At the very least do not be in a rush to go short a market after a significant price advance especially when a Doji candlestick forms. Wait for confirming signals to indicate the actual turn or continuation of a trend.
I wish you well in your trading and want to commend you for wanting to continue to learn and educate yourself to new ideas. If you are experienced in candlestick chart pattern recognition techniques then I hope this brings new meaning or refreshes your outlook.
Best Wishes,
John L. Person
Japanese Candlesticks. This is one of the oldest methods of charting dating back 400 years in Japan!
This article is on a specific candle pattern called the Doji. Recognizing it is pretty straightforward. There are several Doji formations, the Dragonfly, the Gravestone and the Rickshaw. The significance behind a doji is the market price establishes a range and closes almost exactly where it opens. Give or take a tick or two in most cases. Doji's help form two and three candle formations that can develop into more powerful and trust-worthy signals once identified.
Doji's indicate indecision, the market ends where it began. Confidence is lost from buyers or sellers on the open as the market made a lot of intraday noise as the range was established. In a bullish or bearish trending market, indecision is the last thing you want to see. Strong rejection or failure from the high and or low is a significant tell-tale sign that changes are coming.
In a strong up-trending market, usually the market will close near the high as larger capitalized traders feel comfortable in holding positions overnight or in fact adding to their positions. If the large money traders are not confident the market will move higher in price, then usually the market settles back near the open.
The mystique surrounding this formation called a Doji is that it identifies a potential turning point or market reversals, especially at market tops. That is what most people understand the Doji to signify. Some experts even go as far as stating that Doji Tops should be sold no matter what. I actually disagree with that analysis and conclude while Doji's do indicate indecision, they can also signal a continuation of the current trend. The indecision that it clearly illustrates as the market closes back at the open is part of the key to understanding the potential next price move.
Imagine after a long run up in prices, a strong market would normally be identified by closing near the upper boundary of the range higher than the opening range and higher than the previous settlement.
With the Doji, the market closes back at the opening area as market participants bail out of positions from where the market opened. It is the pause or hesitation that may create longs to sell or liquidate their holdings and possibly attract short sellers. Those are the professionals who are betting the market will decline in price and that the market in effect has topped out.
However, within one or two sessions, let's say market participants decide that they reaffirm their bullish bias; this may cause a breakout and or a reversal so that the uptrend will resume. The bulls have made a stronger conviction that the market can appreciate further in value.
Then there are the bears or short sellers who now are on the losing end of the stick. They need to pony up more money and or get out of their short position, which requires buying into the market. That is called a short squeeze play. In the chart below we see a long uptrend and then a breakout to new highs. Then a pause and a four period session consolidation develops. Then a Doji forms. A Doji would have signaled a top but observe closely how the very next candle blasted off with a higher closing high than the Dojis high.
That is the trigger to go long, or if you are short to immediately get out of your position. If you go long, your risk is a stop close only below the Doji's low. In fact, that strategy would have worked at the bottom in late August. Also, look at the high close break out in mid-September when it closed above 45.00. It closed above the high made by the shooting star. These are the signals that the market tells us and that the candle patterns illustrate in a more visual manner.
This next chart example is of the Canadian Dollar, and as you can see, once the market started the trend higher the Doji forms, causing a one day pause in the market. The trade setup or lets say alert is that a Doji forms. However, we cannot act on this information alone.
The market is telling us there is doubt. We need to wait for the true direction of the market to trigger an entry. The next session as we approach the close is the trigger. Therefore we will buy on the close as we are above the Doji's High. This is the Canadian Dollar Futures. It does trade nearly 24 hours. If you cannot get the order in on the close, certainly turn to the Globex session and buy at the market or on the open of the next session. This method works for all markets, stocks forex and futures. It is also extremely effective in different time frames. When using this method for short term trading I generally stick with the 5, 15, 30, 60 and a 200 minute chart. The later works out to a half a day time period, which I use to help me determine the short term trend.
One point I would like to mention is in liquid and active markets Doji's do not materialize often. When they do I recommend that you pay close attention and use the secrets they identify wisely. At the very least do not be in a rush to go short a market after a significant price advance especially when a Doji candlestick forms. Wait for confirming signals to indicate the actual turn or continuation of a trend.
I wish you well in your trading and want to commend you for wanting to continue to learn and educate yourself to new ideas. If you are experienced in candlestick chart pattern recognition techniques then I hope this brings new meaning or refreshes your outlook.
Best Wishes,
John L. Person
Last edited by a moderator: