Is trading just a game of cat and mouse? Do we smaller traders - the mice - get noticed nibbling the cheese (profits) on the mouse traps set by the cats (the major player)?
A Game of Cat and Mouse
In my decades of trading, I've learned many lessons about the market. The chief of these lessons is that I don't know anything about the market; at least, in comparison to the market makers on Wall Street. Think about it. The traders at firms like Goldman Sachs, Merrill Lynch and the like pull down salaries of several million dollars each year. I refuse to believe that they are so richly compensated because they don't know anything. They know a lot! It's their job!
As a result, like many individual investors, I engage daily in a game of follow the leader. In other words, I find out what the market makers are doing and then I follow their lead. If the market maker has set a strategy of buying at, say, $10.48 and selling at, say, $10.75, guess what my strategy is?
Of course, I'm not the only one employing this strategy. There are literally tens of thousands of us playing this game of cat and mouse. I know this to be true because, over the years, I've trained countless investors to do just that.
The Cats Have Caught On
Sadly, in any game of cat and mouse, some mice are going to get caught in a trap. And, sadly, the individual investor is the mouse in this game. The truth of the matter is that the market makers are onto us. They've noticed us nibbling away at their profits and are now taking defensive action. In short, they are attempting to camouflage their actions. Even worse, in many cases, they will engage in active deception to make us think they have one strategy (e.g., to buy) when their strategy is just the opposite (e.g., to sell).
How are they able to pull this off? In a sense, trading in the market is like playing a game of poker; a really big game of poker. The players (at least, the good ones) attempt to keep their cards close to the vest. Think about it. The worst thing you can do in a game of poker is to show your opponents your cards. If you do, they will know when they should bet and when they should fold.
The same is true in the trading game. A market maker with a weak position isn't going to tip his hand. Instead, he's going to try to bluff you into thinking that he has a strong position. Likewise, when the market maker has a strong position, he will attempt to "slowplay" his hand to sucker you into making a mistake by betting against him. Market makers use this same level of deception in the stock market.
Remember, when you look at a Level II screen like the one below, you get a wealth of information. However, don't be fooled into thinking that you're getting the whole story.
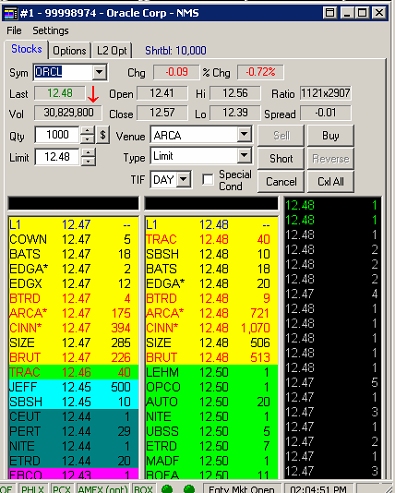
In the previous example, we can see that SBSH (Citigroup) is offering to sell 10 round lots at $12.48. However, this doesn't mean that the Citigroup trader doesn't have more than 10 round lots to sell. He might be sitting on 10 or even 100 times that amount.
Obviously, if he were announce to the world that he was sitting on tons of shares, it would negatively impact the price of the stock. The players on the bid side of the equation would know that Citigroup has an excess of inventory and act accordingly.
So how does Citigroup camouflage its position? It's actually quite simple. Instead of putting up all 1,000 (or 10,000) lots at the same time, it simply dribbles them out a little at a time. Every time, the trader is able to dump a few shares, he immediately refreshes his ask to reflect that he has a few more shares to sell.
In addition, don't forget that market makers are free to trade through ECNs, just like you and me. By trading through an ECN, they can camouflage their position. In the example above, we see that ARCA (Archipelago) is looking to sell 721 round lots at the same price. Who says that some (or even most of these shares) aren't held by Citigroup?
As you can see, market makers have multiple options in which to throw you off the scent. However, even worse, in some cases, the market makers will do more than just hide their motives. They'll trap you into thinking that they are going one way and then head in just the opposite direction. The most popular (and dangerous) of these "head and shoulder fakes" is for them to use reverse psychology on you.
Don't Get Turned Upside Down
If you're not careful, a clever market maker can get you so turned around that you don't know up from down. Take a look at the following Level II screenshot:
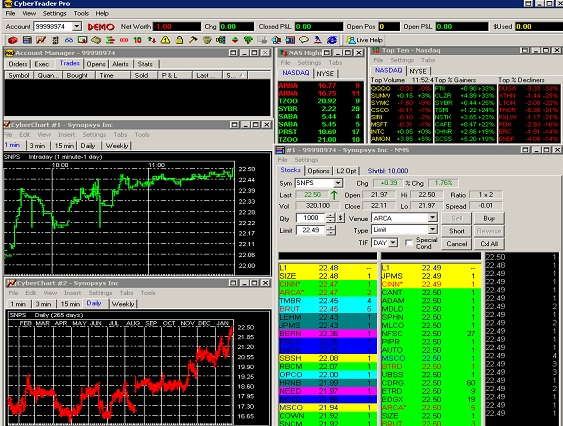
As you can see, the ask side of the equation is literally filled with sellers. Three market makers want to sell at $22.49 and at least another 17 want to sell at $22.50. Do you think this stock is going to rise in value? On first glance, the answer is "No." There seems to be simply too much sell-side pressure on the stock.
And you certainly wouldn't want to go long on this stock. Even if the stock rises, the next umpteenth trades are going to be at $22.49 and $22.50. You have very limited upside potential. On the other hand, if the stock reverses course and trades go off at the bid price, the stock could fall to as low as $21.92. No one in their right mind would buy a stock with a 2¢ upside when the down side is more than 50¢, right?
Sadly, this is just what the market makers want you to think. You've taken the bait. In the example below, the stock rose to $23.01 in a matter of minutes. How did this happen? It's actually quite simple. The market makers set a reverse psychology trap. They made the average investor think that the stock was going down by cluttering the ask side with several tiny trades at or just slightly above the current trading price. At a casual glance, the typical investor would think that the sell side pressure was too great and avoid getting in on the action.
Needless to say, market makers set bid side traps as well. They will clutter the bid side with many small orders to purchase at or just above the current stock price. The average investor will look at all of this buy-side pressure and think, "This stock is going to the moon! I've got to get in on it." And sadly, within a matter of minutes, they will see the stock drop sharply.
The market makers knew it all the time, but they needed someone to purchase their shares before the stock tanked. Therefore, they created the appearance of a buying opportunity when it was actually a time to sell sell, sell. The investors who get caught in such a trap never see it coming.
The Trend is Your Friend
So how do you avoid being one of these investors? How do you spot a trap? Well, let's take another look at the screenshot from above:

The key to recognizing this trap is to look at the trend lines. As I like to say to my students, "The trend is your friend." In this case, the stock was trending upward while the bids and asks made it look like a loser. Whenever you see such an inconsistency, watch out! You're probably walking into a trap.
To illustrate take a look at the following real-life example I observed:
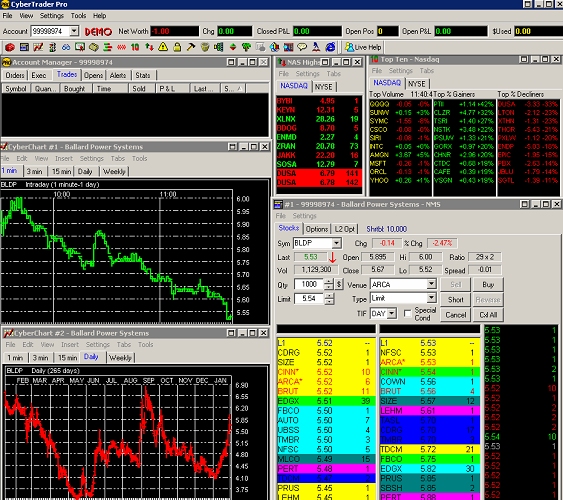
At first glance, this stock looks like a real winner, right? There seems to be a lot of buy-side pressure. There are several market makers looking to purchase shares at $5.45-$5.52. On the other side of the coin, the ask side is not nearly as crowded and the prices vary much more; from $5.53-$5.86. There doesn't seem to be too much downside in purchasing the stock and a lot of upside in doing so, right?
Not so fast. Look at the trend lines on the left. This stock has been trending downward for the last two hours. Want to take a guess at which way the stock went? You guessed it. Down! And quickly. By the end of the day, this stock was trading at $5.34. I don't want to think about how many people fell victim to that market maker trap.
A Word to the Wise
You don't have to be one of these people so long as you remember that the trend is your friend. Whenever you're evaluating the bid and ask prices of a stock to determine where the smart money is, make sure that it jibes with the current trend. If the current trend is down but the stock looks like it's going up, be wary. Be equally wary if the opposite is true. Remember, in a game of cat and mouse, the cautious mouse stands a much better chance of avoiding the metal spring of the trap.
A Game of Cat and Mouse
In my decades of trading, I've learned many lessons about the market. The chief of these lessons is that I don't know anything about the market; at least, in comparison to the market makers on Wall Street. Think about it. The traders at firms like Goldman Sachs, Merrill Lynch and the like pull down salaries of several million dollars each year. I refuse to believe that they are so richly compensated because they don't know anything. They know a lot! It's their job!
As a result, like many individual investors, I engage daily in a game of follow the leader. In other words, I find out what the market makers are doing and then I follow their lead. If the market maker has set a strategy of buying at, say, $10.48 and selling at, say, $10.75, guess what my strategy is?
Of course, I'm not the only one employing this strategy. There are literally tens of thousands of us playing this game of cat and mouse. I know this to be true because, over the years, I've trained countless investors to do just that.
The Cats Have Caught On
Sadly, in any game of cat and mouse, some mice are going to get caught in a trap. And, sadly, the individual investor is the mouse in this game. The truth of the matter is that the market makers are onto us. They've noticed us nibbling away at their profits and are now taking defensive action. In short, they are attempting to camouflage their actions. Even worse, in many cases, they will engage in active deception to make us think they have one strategy (e.g., to buy) when their strategy is just the opposite (e.g., to sell).
How are they able to pull this off? In a sense, trading in the market is like playing a game of poker; a really big game of poker. The players (at least, the good ones) attempt to keep their cards close to the vest. Think about it. The worst thing you can do in a game of poker is to show your opponents your cards. If you do, they will know when they should bet and when they should fold.
The same is true in the trading game. A market maker with a weak position isn't going to tip his hand. Instead, he's going to try to bluff you into thinking that he has a strong position. Likewise, when the market maker has a strong position, he will attempt to "slowplay" his hand to sucker you into making a mistake by betting against him. Market makers use this same level of deception in the stock market.
Remember, when you look at a Level II screen like the one below, you get a wealth of information. However, don't be fooled into thinking that you're getting the whole story.
In the previous example, we can see that SBSH (Citigroup) is offering to sell 10 round lots at $12.48. However, this doesn't mean that the Citigroup trader doesn't have more than 10 round lots to sell. He might be sitting on 10 or even 100 times that amount.
Obviously, if he were announce to the world that he was sitting on tons of shares, it would negatively impact the price of the stock. The players on the bid side of the equation would know that Citigroup has an excess of inventory and act accordingly.
So how does Citigroup camouflage its position? It's actually quite simple. Instead of putting up all 1,000 (or 10,000) lots at the same time, it simply dribbles them out a little at a time. Every time, the trader is able to dump a few shares, he immediately refreshes his ask to reflect that he has a few more shares to sell.
In addition, don't forget that market makers are free to trade through ECNs, just like you and me. By trading through an ECN, they can camouflage their position. In the example above, we see that ARCA (Archipelago) is looking to sell 721 round lots at the same price. Who says that some (or even most of these shares) aren't held by Citigroup?
As you can see, market makers have multiple options in which to throw you off the scent. However, even worse, in some cases, the market makers will do more than just hide their motives. They'll trap you into thinking that they are going one way and then head in just the opposite direction. The most popular (and dangerous) of these "head and shoulder fakes" is for them to use reverse psychology on you.
Don't Get Turned Upside Down
If you're not careful, a clever market maker can get you so turned around that you don't know up from down. Take a look at the following Level II screenshot:
As you can see, the ask side of the equation is literally filled with sellers. Three market makers want to sell at $22.49 and at least another 17 want to sell at $22.50. Do you think this stock is going to rise in value? On first glance, the answer is "No." There seems to be simply too much sell-side pressure on the stock.
And you certainly wouldn't want to go long on this stock. Even if the stock rises, the next umpteenth trades are going to be at $22.49 and $22.50. You have very limited upside potential. On the other hand, if the stock reverses course and trades go off at the bid price, the stock could fall to as low as $21.92. No one in their right mind would buy a stock with a 2¢ upside when the down side is more than 50¢, right?
Sadly, this is just what the market makers want you to think. You've taken the bait. In the example below, the stock rose to $23.01 in a matter of minutes. How did this happen? It's actually quite simple. The market makers set a reverse psychology trap. They made the average investor think that the stock was going down by cluttering the ask side with several tiny trades at or just slightly above the current trading price. At a casual glance, the typical investor would think that the sell side pressure was too great and avoid getting in on the action.
Needless to say, market makers set bid side traps as well. They will clutter the bid side with many small orders to purchase at or just above the current stock price. The average investor will look at all of this buy-side pressure and think, "This stock is going to the moon! I've got to get in on it." And sadly, within a matter of minutes, they will see the stock drop sharply.
The market makers knew it all the time, but they needed someone to purchase their shares before the stock tanked. Therefore, they created the appearance of a buying opportunity when it was actually a time to sell sell, sell. The investors who get caught in such a trap never see it coming.
The Trend is Your Friend
So how do you avoid being one of these investors? How do you spot a trap? Well, let's take another look at the screenshot from above:
The key to recognizing this trap is to look at the trend lines. As I like to say to my students, "The trend is your friend." In this case, the stock was trending upward while the bids and asks made it look like a loser. Whenever you see such an inconsistency, watch out! You're probably walking into a trap.
To illustrate take a look at the following real-life example I observed:
At first glance, this stock looks like a real winner, right? There seems to be a lot of buy-side pressure. There are several market makers looking to purchase shares at $5.45-$5.52. On the other side of the coin, the ask side is not nearly as crowded and the prices vary much more; from $5.53-$5.86. There doesn't seem to be too much downside in purchasing the stock and a lot of upside in doing so, right?
Not so fast. Look at the trend lines on the left. This stock has been trending downward for the last two hours. Want to take a guess at which way the stock went? You guessed it. Down! And quickly. By the end of the day, this stock was trading at $5.34. I don't want to think about how many people fell victim to that market maker trap.
A Word to the Wise
You don't have to be one of these people so long as you remember that the trend is your friend. Whenever you're evaluating the bid and ask prices of a stock to determine where the smart money is, make sure that it jibes with the current trend. If the current trend is down but the stock looks like it's going up, be wary. Be equally wary if the opposite is true. Remember, in a game of cat and mouse, the cautious mouse stands a much better chance of avoiding the metal spring of the trap.
Last edited by a moderator: