OK just read through this thread, interesting.
FC please could you just clearly restate the rules as they are now as if talking to an idiot so that it is clear where we are at, at least to me anyway. duuuuhhhh! If I know that, then I will know if I have anything to contribute.
Thoughts so far:
I have found that combined range and breakout systems work best. If choosing one or the other I would have to stick with the breakouts but I have found that taking initial signals as a range trade with a reversal or size increase for breakouts work consistently well and better than breakout alone. It is better to incorporate a breakout on range systems as they also serve a function as a stop/reverse mechanism that pure range systems otherwise have a drawdown problem with. I have found they are, over time, better than simple stops. Even if you end up with a few costly whips at least you know you are on all the major breaks and stay in short term channels. Admittedly these require some non generic values, at least as far as my research has so far taken me.
As to indicators I have not dismissed them myself as I find they can often work as great moderators for price action based systems. By this I mean a system that may limit to only long or only short price action based signals during certain periods dependent on a specified criteria of an indicator whether this be a simple ma vs price or some other thing such as Stochs. IMO indicators make useful references and I do not understand their total dismissal as if they are some sort of evil hindrance. All the charts I look at daily have candles with slow stoch and single MA or Bolli Bands these are great reference tools even if only trading price action.
I think it is pretty difficult not to consider open position drawdown as this is actually critical when you start putting money down. It is particularly important when you are deciding account funding requirements and leverage. Even if just marking to market on the close of each day you really need to incorporate this into the equity curves.
JonnyT why you limit yourself to 7-10 ? IMO the US session is just as important so better to think in terms of 2 sessions per day the second starting around 12:30 at least this is what I have found.
fc
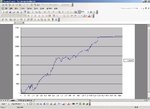
you might find the attached 10 year study of S&P interesting. You'll have to draw in the lines yourself but you will see a couple of interesting bits. eg) if the price has moved in the same direction each day Monday through Thursday (XXXX) then there's a 62% chance of the same on Friday (thus XXXXX) and only a 38% chance of reversal (XXXXO)
good trading
jon
Seems from figures as if the week starts at XXX
At this point sell Thursday open buy back on close. If Thursday is also X buy Friday open.
Is it really that simple?