WhatsUpDow
Junior member
- Messages
- 17
- Likes
- 1
Will consolidate all my posts here.
15-12-05
http://www.trade2win.com/boards/showthread.php?t=17998
16-12-05
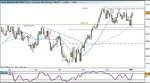
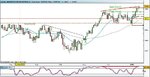
Yesterday:
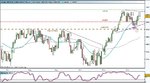
Open: 10883.4
High: 10938.7
Low: 10865.4
Close: 10881.7
"and upside break above the 10900 level could see the resumption of the November Bull.."
Similar direction yesterday when the Dow opened below 10900 zone and break upwards by more than 50 points only to lose momentum to close below 10900 level. at 10881.7 Still holding longs at 10798 and Stop adjusted to 10811 to take a 62 point risk for this bet.
A Doji formed yesterday indicating indecision. Price closing above 20MA offers temporary support at 10839. Lower REd-line offers immediate support at 10800 while Blue divergence line, also the Up-channel line at 10760. A break above Upper Green line resistance at 10960 should send the Dow to the much talked about 11000 mark. We need a Close above the 10950 mark to confirm further upward moves.

15-12-05
http://www.trade2win.com/boards/showthread.php?t=17998
16-12-05
Yesterday:
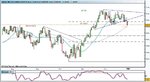
Open: 10883.4
High: 10938.7
Low: 10865.4
Close: 10881.7
"and upside break above the 10900 level could see the resumption of the November Bull.."
Similar direction yesterday when the Dow opened below 10900 zone and break upwards by more than 50 points only to lose momentum to close below 10900 level. at 10881.7 Still holding longs at 10798 and Stop adjusted to 10811 to take a 62 point risk for this bet.
A Doji formed yesterday indicating indecision. Price closing above 20MA offers temporary support at 10839. Lower REd-line offers immediate support at 10800 while Blue divergence line, also the Up-channel line at 10760. A break above Upper Green line resistance at 10960 should send the Dow to the much talked about 11000 mark. We need a Close above the 10950 mark to confirm further upward moves.

Last edited: