You are using an out of date browser. It may not display this or other websites correctly.
You should upgrade or use an alternative browser.
You should upgrade or use an alternative browser.
cuotes
Active member
- Messages
- 236
- Likes
- 29
Several whole books has been written on stock trend identification.
So, I can do little contribution here.
Later, chances are that other high qualified members will give you their valuable justifications and ideas.
Before they come, it could be worthy to clarify some points. I assume you don't like definitions, but unfortunately I love them.
General speaking we could define it as: Pattern of gradual change in a condition over time.
In this case, the current general direction of movement for prices or rates.
Investopedia give us another definition: The general direction of a market or of the price of an asset. Trends can vary in length from short, to intermediate, to long term.
Enough definitions.
Regardless of how one defines it, the target of trend trading is the same, namely, join the move early and hold the position until the trend ends.
So, how can we identify a trend?
Some identify trends as a deviation from a range as indicated by Bollinger Band. For others, a trend occurs when prices are contained by an upward or downward sloping x-period simple moving average (SMA).
No doubt, the simplest identifiers of trend direction are higher lows in an uptrend and lower highs in a downtrend.
Now, we have a little of theory background.
Let's talk about identification mechanisms.
Identify a trend is pretty simple. Just take a look to the chart and you'll see immediately the trend or the lack of it. Why it is so easy? Because our brain is probably the most advanced and perfect mechanism of pattern recognition.
How do you distinguish among the other humans beings around you? Your brain execute a pattern recognition process on them with a velocity and accuracy that no computer over the world can achieve.
Now, you want to do the same with a little of programming, or even better with one or two predefined indicators.
Good luck!!! Don't forget to write a book when you finish.
IMHO, you can't do it.
You can try some approaches, but you will never get something consistent. Tiny deviations will confuse your system. You brain can make allowance of thousands of tiny deviations and variables, but an algorithm... difficult. Let's go back to the definitions above for a second.
Did you realize that I stressed in red the word general?
It isn't easy task to synthesize general and changing concepts into a set of defined rules.
You can use some kind of indicator to help you to identify trends, but it will be you who finally decide.
Anyway, more info here : This article and more available at Investopedia.com
tenbobtrader
Guest
- Messages
- 450
- Likes
- 140
Justify it by what? You justify it by your own criteria. Others may not agree with you but that is the nature of trading. If the price keeps on the left side of the trendline (going up), I can't see what more justification you need.
good post Split
something I found on my travels that might prompt some thought regards developing your own criteria
"In the early days of the Internet, before the explosion of financial information related to the current mania, there were few places where traders could exchange information outside of the brokerage business. I stumbled upon the AvidTrader site and they had a free chat line. I hung around there for a long time and one day, a gentleman using the handle "oleman", an S&P futures trader, came into the site. We became regulars on the site and at some point, I sent him an email, asking him about his methods. He replied that he traded like Forrest Gump.
His basic logic went something like this. We are told to buy low and sell high. We are told to follow the trend. These would appear to be mutually exclusive at first glance. The only way to make these two statements reconcile is if we change it to "buy high, sell higher" or "sell low, buy back lower". I was struck dumb by the power and the simplicity of his idea. It was as if I had sailed for a lifetime on the open ocean expecting to fall off the edge and suddenly discovering that the earth was round instead. Perhaps it was like the moment when the apple fell on Isaac Newton's head and he "discovered" gravity. Suddenly it all became clear to me. I was free.
Let's get technical. What is an uptrend? What is a downtrend? Victor Sperandeo, in his first book, Trader Vic- Methods of a Wall Street Master, defines it perfectly:
Upward Trend - An upward trend is a series of successive rallies that penetrate previous high points, interrupted by sell-offs or declines, which terminate above the low points of the preceding sell-off. In other words, an uptrend is a price movement consisting of a series of higher highs and higher lows.
Downward Trend - A downward trend is a series of successive declines which penetrate previous low points, interrupted by rallies or increases which terminate below the high points of the preceding rally. In other words, a downtrend is a price movement consisting of a series of lower lows and lower highs.
This is simple enough but 90 percent of traders probably couldn't tell you off the top of their heads. Once we know the definition of uptrend and downtrend, we are already ahead and on our way. The next thing we need to do is to draw a trend line correctly. It becomes a game of connect the dots. Sperandeo continues:
"For an uptrend within the period of consideration, draw a line from the lowest low, up and to the highest minor low point preceding the highest high so that the line does not pass through prices in between the two low points. Extend the line upwards past the highest high point. It is possible that the line will go through prices past the highest minor high point. In fact, this is one indication of a change in trend, as will be demonstrated shortly."
"For a downtrend within the period of consideration, draw a line from the highest high point to the lowest minor high point preceding the lowest low so that the line does not pass through prices in between the two high points. Extend the line past the lowest high point downward."
Armed with the definition of uptrend and downtrend Oleman said that in his trading he would buy every dip on the way up and be wrong once at the top, whereupon prices would fail to make a higher high. And on a downtrend, he would sell every rally and be wrong once at the bottom when it would fail to make a lower low. How much simpler could it be? It sure beat what I had seen being done by the desk traders and retail clients all around me, namely, buying every lower low trying to catch the bottom and then shorting each higher high to try to get a top. These people were trading their egos. I thought it would be a good idea to just trade like Forrest Gump and make money instead. I did not press him further for he had parted with a real gem. He did say something about using Average True Range. I did not think it was right for me to ask for more handouts. It was time for me to find a way to employ this fundamental truth. The secret was so simple and so correct. I had indeed missed the "Forrest" by getting too close to the trees.
My mission was defined. I already knew how to take my losses quickly but I was not too elegant in my approach. I wasn't great at letting my profits run because I had the trader's version of permanent post-traumatic stress disorder caused by the Crash of '87. First, I would go back to my pile of books to find methods of identifying uptrends and downtrends. Second, I would find ways to identify and buy each dip on an uptrend and to sell every rally on a downtrend. Out of those ideas, I could find better places to put stop loss orders and find ways to use stop loss orders to alleviate my anxiety when I was up on a trade."
by Teresa Lo
later
Andy
roughbert
Member
- Messages
- 94
- Likes
- 1
Tenbob - I thought I read that somewhere else - it was here - Technical Analysis Wizards Den: trading tactics, tutorials and strategies for day trading and short-term trading using technical analysis. and maybe elsewhere too.
Nothing new under the sun eh?
BTW if you want to practice drawing trendlines over charts, try the Fiboverchart application at www.usetronics.com.
Nothing new under the sun eh?
BTW if you want to practice drawing trendlines over charts, try the Fiboverchart application at www.usetronics.com.
Beauty and trends are in the eye of the beholder
To the various examples already given on this thread I could add things like instaneous trend lines (Ehlers), Schaff trend cycle and Spuds stochastic fishnets !
It is said that markets trend for about 20% of the time. (hmm - does that 80/20 ratio apply to everything 😆). Another approach then might be to define when the market is not in a trending phase but in a consolidation phase, so it would be worth defining the characteristics of a "non-trend".
It is also important to look at timeframes, because the market can appear to be in a trending phase on one timeframe and not another. Alternatively it may be in a down-trend in one TF and an uptrend in another.
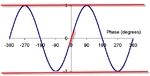
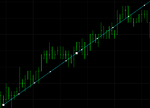
At one view the price might look like the sinewave shown below in a consollidation pattern and not trending at that scale. In another view you might just be looking at the red line drawn on the sinewave - a clear uprward trend. In a different TF it might look like the second picture or even choppier or with more well-defined retracements.
Certainly trying to program trading a trend is not always as easy as it might first seem.
I think this is akin to defining beauty. We all know it when we see it, but everyone defines it differently. Most definitions will have some truth in them, but not one of them captures it perfectly
Charlton
I think you hit it on the head here. There are a range of definitions, a range of price action patterns and indicaors that have been defined to define the start, end and the ongoing existence of a trend.You can try some approaches, but you will never get something consistent. Tiny deviations will confuse your system. You brain can make allowance of thousands of tiny deviations and variables, but an algorithm... difficult.
To the various examples already given on this thread I could add things like instaneous trend lines (Ehlers), Schaff trend cycle and Spuds stochastic fishnets !
It is said that markets trend for about 20% of the time. (hmm - does that 80/20 ratio apply to everything 😆). Another approach then might be to define when the market is not in a trending phase but in a consolidation phase, so it would be worth defining the characteristics of a "non-trend".
It is also important to look at timeframes, because the market can appear to be in a trending phase on one timeframe and not another. Alternatively it may be in a down-trend in one TF and an uptrend in another.
At one view the price might look like the sinewave shown below in a consollidation pattern and not trending at that scale. In another view you might just be looking at the red line drawn on the sinewave - a clear uprward trend. In a different TF it might look like the second picture or even choppier or with more well-defined retracements.
Certainly trying to program trading a trend is not always as easy as it might first seem.
I think this is akin to defining beauty. We all know it when we see it, but everyone defines it differently. Most definitions will have some truth in them, but not one of them captures it perfectly
Charlton
Attachments
Yes, Charlton, but he wants us to justify the trend, not define it. What you have given, as an example, needs no justification. It is. It's a great TL Hindsight? I don't think so, either. That last high would not need much to get me interested in reversing, it has the look of a failed high, to me. In any case, wrong or not, I'd be looking to short there with a new TL going down. Draw it at 43.5º, draw it as you like and to hell with tops! Every entry has its risks so what's wrong with this one? If the price stays on the right of it, that's all the justification that I need .
Self-justfication
Justification and your point about the last high is an interesting one. How does one "justify" a trend line. It would have been possible to make money out of my poor example, but there would have been better trend lines where you could have made a lot more.
This brings into play time and trading style as well. A flatter trendline might bear the hallmarks of a "most beautiful" trend line, but the period between entry and exit will become extended raising the question of whether one could have made more profit elsewhere. If justification is measured as profitability then justification can equally be applied to non-trending phases and raises the oft-discussed question of whether it is more profitable to exit and re-enter at retracements (or potential turning points) or to hold. The trend is your friend, but only till the end.
We should also consider the difference between "trend" and "trendline". The latter is merely a representation of the former (some ethereal reality) - a tool for trading. This is perhaps veering to the realms of the metaphysical, but it reminds me of Green123's original question "Please do not just define...Justify !!!". When I read this I immediately thought of a university essay - that is the style that this brings to mind.
So after all this rambling, getting back to the practical, your last phrase really sums it up "that's all the justification that I need". It doesn't really matter how you define it, whether you define it at all and whether or not others agree with your definition. The important thing is: if and how you use your personal definition in your personal trading and the effect it has on your personal equity curve.
Other people's views along the way may help and clarify ways of incorporating the concept of trend into your trading to your benefit, but ultimately (like everything else in trading) you need to grasp it and make it your own.
Charlton
Agreed - it's not the greatest example of a trendline. It is in fact ES from earlier this evening and just drawn to illustrate that however you draw a trendline price will chop around it.Yes, Charlton, but he wants us to justify the trend, not define it. What you have given, as an example, needs no justification. It is. It's a great TL Hindsight? I don't think so, either. That last high would not need much to get me interested in reversing, it has the look of a failed high, to me. In any case, wrong or not, I'd be looking to short there with a new TL going down. Draw it at 43.5º, draw it as you like and to hell with tops! Every entry has its risks so what's wrong with this one? If the price stays on the right of it, that's all the justification that I need .
Justification and your point about the last high is an interesting one. How does one "justify" a trend line. It would have been possible to make money out of my poor example, but there would have been better trend lines where you could have made a lot more.
This brings into play time and trading style as well. A flatter trendline might bear the hallmarks of a "most beautiful" trend line, but the period between entry and exit will become extended raising the question of whether one could have made more profit elsewhere. If justification is measured as profitability then justification can equally be applied to non-trending phases and raises the oft-discussed question of whether it is more profitable to exit and re-enter at retracements (or potential turning points) or to hold. The trend is your friend, but only till the end.
We should also consider the difference between "trend" and "trendline". The latter is merely a representation of the former (some ethereal reality) - a tool for trading. This is perhaps veering to the realms of the metaphysical, but it reminds me of Green123's original question "Please do not just define...Justify !!!". When I read this I immediately thought of a university essay - that is the style that this brings to mind.
So after all this rambling, getting back to the practical, your last phrase really sums it up "that's all the justification that I need". It doesn't really matter how you define it, whether you define it at all and whether or not others agree with your definition. The important thing is: if and how you use your personal definition in your personal trading and the effect it has on your personal equity curve.
Other people's views along the way may help and clarify ways of incorporating the concept of trend into your trading to your benefit, but ultimately (like everything else in trading) you need to grasp it and make it your own.
Charlton
Last edited:
roughbert
Member
- Messages
- 94
- Likes
- 1
Exactly. Once you have defined the timeframe, you can more easily determine the trend, and I would guess you can fit a line to it more reliably. The limiting case would be two observations, there can be no doubt about the trend (i.e. the slope of the line drawn between the points) there! The more points, the less confidence in statistical methods of determining whether there is a trend, and again the question arises - how do you define "trend". I suspect that prices towards the right hand end of a timeframe are given a bigger weighting by the human interpreter, so a point below the average near the end of the timeframe is more likely to be interpreted as the end of the trend than a point in the middle. Maybe you could use AI to learn how to recognise a trend from human teachers.It is also important to look at timeframes, because the market can appear to be in a trending phase on one timeframe and not another. Alternatively it may be in a down-trend in one TF and an uptrend in another.
Agreed - it's not the greatest example of a trendline. It is in fact ES from earlier this evening and just drawn to illustrate that however you draw a trendline price will chop around it.
Justification and your point about the last high is an interesting one. How does one "justify" a trend line. It would have been possible to make money out of my poor example, but there would have been better trend lines where you could have made a lot more.
This brings into play time and trading style as well. A flatter trendline might bear the hallmarks of a "most beautiful" trend line, but the period between entry and exit will become extended raising the question of whether one could have made more profit elsewhere. If justification is measured as profitability then justification can equally be applied to non-trending phases and raises the oft-discussed question of whether it is more profitable to exit and re-enter at retracements (or potential turning points) or to hold. The trend is your friend, but only till the end.
We should also consider the difference between "trend" and "trendline". The latter is merely a representation of the former (some ethereal reality) - a tool for trading. This is perhaps veering to the realms of the metaphysical, but it reminds me of Green123's original question "Please do not just define...Justify !!!". When I read this I immediately thought of a university essay - that is the style that this brings to mind.
So after all this rambling, getting back to the practical, your last phrase really sums it up "that's all the justification that I need". It doesn't really matter how you define it, whether you define it at all and whether or not others agree with your definition. The important thing is: if and how you use your personal definition in your personal trading and the effect it has on your personal equity curve.
Other people's views along the way may help and clarify ways of incorporating the concept of trend into your trading to your benefit, but ultimately (like everything else in trading) you need to grasp it and make it your own.
Charlton
Your first sentence interested me. I thought that was a good trendline. Of course it depends on the TF and other factors but I would have been happy to sit back and trade that one. That is an example of how each one of us interprets a chart and makes us different traders. I know that Jack Schwager , whose writings I admire greatly, also likes inside trendlines. I do not like price crossing to the "wrong" side so I would have drawn a line parallel to yours and underneath it, but that is a detail.
Good trading
tenbobtrader
Guest
- Messages
- 450
- Likes
- 140
Please do not just define...Justify !!!
What are trend identification mechanisms ?
Luv
Green
you could perhaps justify it by a simple question ~
Q: what is the fuel for the trend or potential trend if it is still in birth canal
you could perhaps justify it by a simple question ~
Q: what is the fuel for the trend or potential trend if it is still in birth canal
Yes, what gets me into the trade is not the TL. It's something else, a pullback or whatever. Charltons chart, to me, showed the possibility of a failed high. Maybe it was, maybe it wasn't, but the drawing of the TL comes after the trade is opened and just shows me whether I'm on the safe side or not as the trade developes.
meanreversion
Senior member
- Messages
- 3,398
- Likes
- 538
As mentioned, the definition of trend relies on the timeframe. A 10 pip move could be defined as a trend by a scalper, but anything less than 200 pips would not be a trend to a macro trader. I find MACD good at identifying trends (although I don't use it for entry signals). On the daily chart, the 12 day 26 day moving average difference tells you if we are in an uptrend (line above zero) or downtrend (line below zero).
The bit where it gets tricky is if you have MACD falling rapidly towards zero --- is this still an uptrend? Well, maybe, but more likely it's indicating the current trend is coming to an end and reversing.
What I find useful is a supplementary filter to MACD.. don't trade when the line is between +x and -x, because close to zero, the trend is weak or reversing, and you'll probably end up trading the wrong way.
you could perhaps justify it by a simple question ~
Q: what is the fuel for the trend or potential trend if it is still in birth canal
The op does'nt want much eh ten bob...
Christiaan
Active member
- Messages
- 227
- Likes
- 10
The easy way to identify trend is by the use of moving avergages i think your gonna love this one>it's called the wave three exponential moving avergages based on a fibonacci number 34 on close,high and low.Four to six o clock angle is downtrend twelve to 2 uptrend three o clock angle consolidation.
The wave does have a intresting mathamatical realtionship with other indicators for instance the rsi.When prices moves from below the wave to above it the rsi crosses the 50 line moving from bearish to bullish.Also the di's seems to cross when this happen as well.I believe that the wave is an awesome indicator to gauge the current trend,Look at pic
http://img39.imageshack.us/img39/9662/eurusd5m1.png