THT's Methods that WIN

THT

Member
Messages
98
Likes
5
Hi All

This thread is going to cover a lot of trading/Investing genres, its going to be a collective dump of various methods that I use to make money from the market - I've often thought over the years of producing a YouTube channel or selling a manual/book, but I just cannot be bothered with the hassle of dealing with the public and the time to produce, the very few idiots out there would just drive me crazy, so its a case of keep quiet or publish on here

Nothing I plan to post is unique, its out there, I learned it, tested it and traded it, but you may just find that I do it a slightly different way and I won't be posting that many potential trades, its not my aim to highlight possible trades, its my aim to show you methods that work, work well, are profitable and WIN - so there will be a lot of examples that have already happened

Some of the methods covered will be complicated, most however, will be pretty simple - I 100% believe that you can TIME the markets, I'm a massive WD Gann Fan, we will be venturing into his works at some point

I'm assuming a basic working knowledge of trading, such as risk, use of stops, money management, the emotional side etc, but I'll cover part of that as we go along

The 2 things with trading that are guaranteed are:
  1. You'll definitely have LOSSES / losing trades
  2. Its emotionally hard and stressful
The chart below compares the actual performance of the UK and USA markets - from a buy and hold pov - Me & My family hold the ETF in SIPP's & ISA's on a buy and hold strategy (Set and Forget) - so far since the early 2010's It's been a very profitable Investment decision

911.JPG


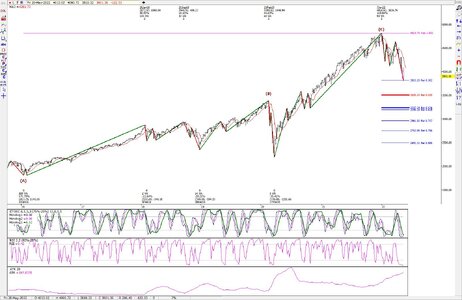
From the chart you can see how poor the FTSE100 has been, the FTSE250 is there on a par with the SP500 and Dow, but the runaway market has been the Nasdaq - for laziness and simplicity, I wanted a GBP based ETF that tracked the Nasdaq Index - This is an Investment and it has nothing to do with trading, but the thinking is linked - this Investment WILL BE SOLD in 2034

The reason it will be sold in 2034 is that is when I believe these major markets top out and turn down hard based on cycle analysis

I only have long term price data back to 1900 for the DJIA - There's no denying the UP/DOWN sequence in play (This sequence goes all the way back to when the DOW started in May 1792 - Its NOT a static cycle of 17 years, it varies between 16-19 years

1024.JPG


From an economic pov - the DOWN sections will always be associated with bad economics, depression etc - take 2000 onwards - its the reason why Interest rates were slashed and unemployment rose, and now seen as we're in the UP cycle section, Interest rates have risen, its not rocket science - you can make some pretty accurate predictions on the economic factors (generic) of the country simply from knowing what cycle type you're in

Here's a prediction for 2034 - Day traders will be back in force en-masse, your plumber will all of a sudden be an "expert", just as the market tops, govts will be spending money on the tick thinking the good times will last forever and then bang!

So what happens apart from 1929*, in EVERY UP cycle section on the chart? The corrections are ALWAYS 100% guaranteed retraced fairly quickly, so the BIAS of your trading should be thinking LONG BUYS for stocks (other markets run differing time cycles) - This doesn't mean the corrections won't happen, but as a trader, we can be aware of their potential and of the opportunity they present when they end - I will show you how you could have timed the Oct 2022 SP500 correction bottom in a future post

I wanted to get you thinking of cycles, as they are Important and I'll show you how to use them and profit from them in trading

*1929 can be explained, but its a bit complicated, but you can see it followed the pattern of all the other UP cycle sections

THT
 
Unless you've worked the markets out like WD Gann did (and there's serious debate if he did or not!) then you're going to have to just accept it that you're playing a game of probability, that being said, you can shove the odds in your favour

These first few posts are going to show you that the markets aren't random - If you "get it" then it will give you confidence putting positions on etc

You've already seen the 16-19 year up down sequence - with buying the low point of the down or bear section as being the great buying opportunity around

Now I used to be a Financial Adviser and I can tell you that 99.999999% of Financial Advisers out there do not have a clue about that cycle, Fund management groups DO, BUT, it would destroy their businesses if they bought all in, then sold all out (something they are not allowed to do anyway due to the rules for being in a fund) - Because of this, its why the fund Industry feed down to advisers "Its Time IN the market, not Timing the market" etc to then feed down to their customers, to try to appease panic, risk etc

The reason that there's a lot of fund sales at the tops is because the public don't listen to their advisers or funds and panic sell out and so the pattern repeats (It's not as simple as that, but read between the lines and you should get the gist)

As I've shown you in the 16-19 year cycle chart, that analogy simply isn't true [time in the market....] and it is all about TIMING the market - I admit it is ultra hard to do, but if I can do it, anyone with half a brain can do it - and I don't mean I can time every move of the market, that would be heaven!, But the BIG moves you can, because we've seen a beautiful 232-35 year low to low cycle in the USA markets repeat, repeat, repeat!

In this next chart all I've done is change the scaling to LOG scale, Run a 1 x 1 [PINK line} Gann angle or a simple trendline would do from the 1982 low to the 2000 high and then copy that line and project from major lows as you can see

WD Gann said "Price & Time levels are related to each other" - This chart proves that theory

Random markets! Yeah right!

1054.JPG


Here's connecting the 1974 LOW to the 2009 LOW (LOG scale)

1056.JPG


Now use that line as a Gann angle 1 x 1 and the other Gann angles show up (LOG scale), mmmmmmmmm are the markets really random?

If you had known the exact price level of the 2009 low - you could have precisely forecast the 1982 turn, 1987 top and the top of 2000 - Bear in mind, you would NOT of been able to calculate the 2009 low price before those events, but the point I'm making is that the key and major price AND time levels are connected!

1057.JPG


Now If your charting software doesn't scale things correctly, you'll struggle to draw proper trend lines - they need to be FIXED in place once drawn and not move as the scaling changes

Please do not think that this is a one size fits all - It definitely isn't, you can see above that not all points hit an angle and what works for the stock market will not fit the commodity or forex markets - EACH market has its own unique cycle(s) and angle

Remember, at this point all I'm showing are the non random nature of the markets - because if they ain't random, then maybe, just maybe we can create some sort of strategy to profit from that non-randomness!

and the biggest point here, is that although timing the market is nice, you do not need to become a timing expert to win, you can win by using pretty simple methods, which we'll get onto at a later date

THT
 
Some of you would of heard of of legendary traders such as WD Gann and Jesse Livermore - I'll show you how they both traded in later posts - For the time being, lets stick with WD Gann..........................

You can do your own research on Gann, the Important bit is that he blew his trading accounts up by the early 1900's - Then he made some amazing discoveries, these discoveries were research into the planets and seeing if they sync'd with the financial markets - to save you a HUGE amount of time and effort, Gann wrote a number of trading courses/manuals etc and had basic ones and truth ones - the truth ones he forced buyers to sign a non-disclosure agreement and very very very little exists of the true courses he wrote. In his basic courses, some versions mention the planets and his Soybeans 1948 Mars/Jupiter chart and his Coffee Santos letter are both available online to see, other than these 2 bits, very little exists - Gann hid the true meaning of everything in his basic courses, so when he says "The 30 year cycle....." He means Saturn cycle etc, but piecing it all together is hard and I'm pretty sure something is missing because its not a simple piece together

This knowledge is Important, as once you start Gann, you'll spend many a year researching going around and around in circles!

So back in 1909, yes 1909, WD Gann produced the following table:

GannFinancialTable.gif


Take a couple of minutes to pick out some dates - SOME (not all) were spot on predictions

Its not 100%, but I wanted to show you what Gann was doing over a century ago in his quest for what the markets are/were doing

This is a 18.6 year cycle and to save you the hassle of working out what relevance that is, its the North Node of the MOON cycle - which when you force it into a sine wave type cycle it creates a up/down sequence, which fits pretty well (not exact though) into the ups and downs of the stock market

On the matter of the Moon - If you think Stonehenge was built for ancient sacrifices and whatnot, do some research on its remarkable positioning with the Sun and Moon, the Saros cycle etc - The true reason Stonehenge was built was written in a book in the 1960's by Gerald Hawkins - Definitely worth buying a copy/read

Its Important you recognise the trends and how everything fits into them - Its pretty clear by now that the stock markets are on some sort of journey which is EVER UPWARD

So if we (YOU) can isolate those periods of TIME which are going to be big bear markets, then you WILL BE ABLE TO PREDICT the UP sections - and trade/Invest accordingly - I'm not going to do that for you, just know that its possible - those of you that want to learn will do so and those of you that don't wish to, won't bother

The chart below shows 3 of those 16-19 yr cycle periods I posted in the 1st post, the sequence here is DOWN then UP then DOWN - Not all cycles are shown, rest assured the BIG lows inc 1987 all have cycles in the sequence

Notice during the 2 DOWN cycles - The BLACK cycle line timed the mid cycle HIGHS perfectly - you could make a fortune just off that once every 32-35 year shorting opportunity

As you can see I published this chart months before (I'd sat on producing the chart since 2012) the August 2015 date - Go look what the UK and USA markets did on that EXACT day!

The RED cycle line starts or ends the big 16-19 year BULL/UP section/cycle

51.JPG


Within those big cycles, you also have INTERNAL cycles, here's a YEARS before the event prediction, to prove its not pie in the sky mumbo jumbo stuff:

237.JPG


They don't also create big moves, the key aspect is being aware and ready and if a decent plunge happens into the date, then you're looking to take a long position etc

Any professional trader would never blindly trade a cycle date, you'd wait for confirmation etc

I'm quite happy to share this basic info - Don't ask for anymore detailed analysis though, as I'm not prepared to share everything I have

Remember, you do not need to know all this stuff to win at trading - but it massively helps - I'm just showing you that the markets are not some random movement of prices, that there's a structure to it all in BOTH TIME & PRICE

If you KNOW that something like 2009* is (should) going to happen, then you don't need to know price levels and if you know the price level something should happen at, you don't need to know the time/date - you just wait for the turn on the date or price level and follow

* The only time in 200 years that the likes of 1974 or 2009 didn't happen as it should was in the civil war of the USA in the mid 1800's, when the country was being rebuilt and huge sums of govt money were thrown into the economy to get it going and rebuilt again

I'll show you examples of this in the next posts, but you can see what I mean by the 2015 prediction and the 2020 one - I doubt there were that many people that predicted that

Staying on the theme of WD Gann and his cycles - in his basic courses, he says things like "Project 90 degrees (veiled planetary reference), hours, days, weeks, months, years to get the next turn" - In Gann language 90 = 90 degrees of the SQUARE, which it is geometrically

Gann worked on the basis that everything squares itself, hence his Gann angles, they move an angle at a set rate of points per bar and when time and price balance or square, then reversals HAVE to happen

You'd spend a lot of time monitoring everything Gann told you to watch and you'd never know what was going to happen - This is why you have to always look BACK in TIME to see if anything happened that length of TIME AGO

In 2023 there was a brief Banking crisis, with a USA bank going bust, it made the news - Now go back 90 years from 2023 and again etc and see if any other "Banking Crisis's" happened around those dates in the past!

You'll see there were, so we can confidently PREDICT that in the year (or very close years around) 2113 that there should be some sort of issue with a bank or multiple banks around that TIME

This all shows you that TIME is patterned and the upshot of that, is that if that is true, then our life paths can't be as free willed as we're led to believe/understand

THT
 
This is the US Treasury 10 Year YEILD - I've not updated this since 2018, but you should get the idea - What we've done here is simply Isolate out repeating STATIC cycles and placed them into a composite Index

I'm not really Interested in Interest rates, but again you could have predicted years ago that rates should start to bottom in 2018/2020 and start rising, along with the "reasons" for the rises (namely Inflation, but really it all came together nicely)

Blue line is the Index, Red line is the composite Index assumption - As you can see its highly (yet not 100%) accurate

The PEAK is 1981 and the trough was 2017/18 - So you can make a pretty highly educated guess as to where Interest rates are going to be heading for the next 30 odd years!

I might at some point forward project this, but its not a priority for me
1048.JPG


I hope you're getting the significance of CYCLES and their effect on financial markets

You'll find that Interest rates work through long cycles but will be range bound within the common sense limits that you'd expect Interest Rates to working within (Near 0% up to double digits)

You could build one hell of a trading/Investing strategy knowing those cycles in the US Treasury above

I'll show you the patterns in the commodity markets - and as promised once all the background Information has been given, I'll show you how to easily trade/Invest these moves - by now you should be highly convinced that the markets ain't random movements

Special mention needs to go to Daniel T F who created this Cycle Index

THT
 
Last edited:
We need to stick with Cycles for a post or two due to their Importance - Bear in mind what works on the stock market, does not have to work on other markets, they all have their own cycles because different types of PEOPLE trade those markets

Its my belief that regardless of everything out there, CYCLES drive the market and its done so in a GEOMETRICAL fashion, in BOTH TIME & PRICE

Including your life, but that's a different thing

Then the "everything" folds in and fits the cycle of the market - This as I've previously mentioned, allows you to be able to "predict" with high accuracy economic events for the cycle

Anyway, we need these things to produce profitable opportunities for us, to consider and use them, otherwise they are just nice to know possibilities with little use in trading/Investing

In the Sine wave Composite Index shown above of the US 10 yr Treasury Yld - you can see that the cycles are STATIC and they don't always fit perfectly, this is one of the Imperfections of using static cycles that you just have to accept, HOWEVER, if you've got the basis of the cycle analysis correct, then overall, the cycle composite [RED line] will fit and follow price action - This then allows you to forward project the composite Index into the future to see where and when turns happen - this gives you one hell of an edge

Here's the composite Index snapshot view of the SP500 Index (Blue line is the WEEKLY SP500 price / Red line is the composite Index of the SP500)

1058.JPG


I'm not showing the entire screenshot as I'm not prepared for the Individual cycles to be seen

As you can see during the 2022 correction, the cycle turned up before price made its last low - this is the Imperfection of static cycles in action and one of the reasons not to blindly trade the composite Index red line

When I get round to showing you how I timed the Oct 2022 LOW on the SP500, bear this composite Index in mind, as it played a part and reinforced the trend reversal go long decision

If you refer back up to the chart that shows the Gann angles from 1982-2000 and then COPIED across the chart and the gann angle that goes up from the 2009 low - price was on that gann angle trendline along with the turn down in the RED composite Index line shown in the SP500 Comp Index shown above in this post! That was a basic warning that markets might top in 2021/22

Also remember based on our basic knowledge and acceptance of the 16-19 yr cycle on the USA markets, the USA stock markets should be moving continually HIGHER up until 2034 - I plan to sit down and map out 2034 onwards in 2025ish, but its pretty safe to say right now that if you are a buy and hold Investor at that time, to expect a pretty close to halving or your portfolio at some points during that 16-19 yr DOWN cycle

Right, in the SP500 there's a 4 year cycle, discovered by Larry Williams and published in one of his books decades ago (can't remember which one)

Its been pretty reliable and it last worked PERFECTLY in Oct 2022 right at the LOW! - See how everything pieces together when you start looking at things properly!

Here's the 4 year cycle until 2019 (I've given up updating this chart as its ingrained into my brain) - As you can see its NOT 100% precise, 2018 turned out to be a HIGH, this can and does happen to cycles - anyway, fast forward project this cycle to its next hit in OCT 2022 and you'd of been aware of the possibility of a LOW around that time, then using other methods (which I'll show you in the next post) you could have been on high alert for a reversal

184.JPG


Lets leave it there for the time being and in the next post or so, I'll show you how you could have timed the Oct 2022 LOW EXACTLY in TIME & PRICE, along with other jiggery pokery of numbers of which I used to call and predict the 2022 HIGH in BOTH TIME & PRICE and I'll show you other times

Here's the chart I sent to a friend BEFORE the event of the SP500 2022 high in 2021

676.JPG


We'll get to the nitty gritty part of making money soon - I'm just proving that the markets aren't random first

THT
 
So lets take a long journey to the 2022 High.......................................

"IF" the markets are non-random and predictable, then we ought to be able to pick out GEOMETRICAL figures, amounts, calculations etc and we can!

Before we start you can't do this on every market swing, but the big turns will have their credentials encroached in GEOMETRICAL amounts in either Price or Time or sometimes BOTH

The journey begins all the way back at the 2002 stock market SP500 bear market LOW at a price of 768.63pts

499.JPG


This converted into WEEKS is 333/334 weeks - continue the sequence forward in TIME

945.JPG


We also have this pseudo calculation on the DJIA from the Mar 2009 LOW

284.JPG


So you continue the theme, which has the next Fib ratio as 1.382

Notice that a properly scaled Gann Angle from the 2009 low was active all those years too

841.JPG


Sometimes the SQUARE ROOT of a price becomes the Time cycle &/or Price sequences - I might cover this later on, but its a bit hit and miss and there's a lot of things that you have to test to see what the particular market is syncing too, which is a lot of work and analysis to establish

Now onto the price, This table covers the main GEOMETRICAL RATIOS of EXPANDING and CONTRACTING GEOMETRICAL STRUCTURES such as a SQUARE & CUBE and general Fibonacci

736.JPG


Harmonic is related the the SQUARE (Sq root 2) and Arithmetic is related to the CUBE (Sq root 3) and Root 5 is related to Sq rt 5 which is the diagonal of 2 squares side by side & then Pi 3.14 - you WILL see these EXACT numbers in the markets (as well as being in the structure of the great pyramid!)

When we were at high school we were taught lots of maths you couldn't understand and had no reason to ever use again, If you look at the 2008 High price of the SP500 (Remember each market is on its own journey so this might not show up on say the DJIA or Nasdaq):

High Price = 1576.09
x by 57.7% = 909.40
Deudct 909.4 from 1576.09 = 666.68

Which was the March 2009 LOW in the SP500

You can obtain the same figure if you use that high school math of using the TAN function of 30 (degrees) on a scientific calculator = 0.577

The SIN function = degrees and ratios of the SQUARE and the TAN function = degrees and ratios of the CUBE

If you do TAN 45 = 1 and THAT is the reason WD Gann used 45 as the unity degree to balance price and time

So in looking for possible price highs in Dec 2021, I used the following geometrical techniques that USED the ratios specified above

Have you heard of Robert Miner of Dynamic Traders? He got me looking at ratios years ago, I DON'T use Elliott Waves, but I have his software as it just does things I look at with ease - We'll If you've read his books, he talks about EXTERNAL Ratios, these are basically the EXPANDING ratios I detailed above - So I RAN EXTERNAL RETRACEMENTS/RATIOS from every decent and major swing of the SP500 Index from 2009 onwards, this is what I got on the chart:

920.JPG


Then the following:

Price RANGE AtoB x by 1.902 projected from A (1.902 is in the table above and its the DIAGONAL of a GOLDEN RECTANGLE)

756.JPG


Also the same very tight price level was projected from this calculation - refer to the table above = HARMONIC and therefore the SQUARE

781.JPG


Notice that the 2020 "plunge" stopped dead EXACT on a % fall of significance

Here's visual of the % fall of the SP500 in 2009 - These things just do not happen randomly and they operate in tandem with the Time Cycle playing out

873.JPG


1 last hocus pocus cycle and price post and then we'll get into the nitty gritty making money posts

THT
 

Attachments

  • 813.JPG
    813.JPG
    220.2 KB · Views: 19
People have belief systems, you can shout until you're blue in the face about something, but if they believe something, you'll never convince them

This is evidenced in the world's financial markets as people know best, yet 95% of them can't trade or Invest properly to make money! Therein lies the answer to the question/problem

OK so I've shown you various ways I predicted both price and time on the SP500 for the 2022 top - there was also a Pi 3.14 calculation 1982-2008 of the price range too, but it was 30 or 40 pts out from memory, so i didn't show it

Here's how I timed the correction in both TIME & PRICE once again for perfect precision

The 50% level as a % or of a range is very significant - Gann referred to it as the Gravity Center

907.JPG


So you would have applied Retreacement % levels from the 2020 Low to the Jan 4th High

As I know the key for Gann angles I applied those down from the Jan 2022 high and to cut a long story short, you have the 1 x 1 [PINK] Gann angle running right through the 50% level of the last major swing up price range as well as the 4 yr OCT cycle due, you'd run a pointer to that level and notice that the 1 x 1 slices the 50% level in OCT, so you don't have to be a genius to have an opinion on that time and price zone

979.JPG


As you know the 45 degree 1 x 1 gann angle is the DIAGONAL of a SQUARE - So you could use the price range as a SQUARE (draw a Gann Box around it does this for you) and you should get some of the harmonics of the original SQUARE/Gann BOX fit price and time action in the new Gann BOX/SQUARE etc and..................................

984.JPG


You can even MOVE the angles of the Gann Box around and some will fit price and time as shown in the chart above!

So that shows you how I timed the 2022 fall - the 50% level and those around it are key LAWS of the market - its why 1974, 1987, 2002 fell to the 50% level

Here's a static cycle on the SOFT commodities market showing a 4yr cycle (another 4 yr cycle!)

478.JPG


Pink to Pink and Blue to Blue = 4 years

Not too hard to devise a trading strategy to take advantage of!

The Issue comes that the cycles can and does INVERT - As you can see the last PINK cycle Inverted to a low - you'd of still used a bit of common sense and realised this as if a 4yr cycle HIGH turns into a LOW, it HAS to MEAN 100% CERTAIN that the price should RALLY

Here's a cycle in GOLD:

Notice the 180 week cycle is GANNS 180, which is twice 90 etc - another example of quasi-pseudo mumbo jumbo numbers appearing in the financial markets

1059.JPG


As you can see there's lots going on if you want to get very technical - but the reason you'd do so is to try to nail down as certain as possible in the land of trading trades - which is much better than guessing

Anyhow, The follow posts will only show you basic trading methods that work, without the fancy dancy technical stuff previous shown to prove that the markets aren't random price movements

THT
 
Last edited:
"Here's a prediction for 2034 - Day traders will be back in force en-masse, your plumber will all of a sudden be an "expert", just as the market tops, govts will be spending money on the tick thinking the good times will last forever and then bang!"

I'd say we don't have to wait for 2034, it's here today. Interesting write-up. I wholeheartedly agree with your statement that "... if they [traders of all types] believe something, you'll never convince them" of anything else. This is especially true of the retail crowd and their occult-like following from the myriad of gurus (ICT and Rob Smith come to mind - I was an acquaintance of Rob's and he truly believed of his intentions).

I would like to hear your opinion of the yield curve and its relevance to recessions as it appears we may be seeing a separation and a trend toward unity (if there is follow-through and the injection of liquidity ceases).

Yield curve 240118.JPG
 
"Here's a prediction for 2034 - Day traders will be back in force en-masse, your plumber will all of a sudden be an "expert", just as the market tops, govts will be spending money on the tick thinking the good times will last forever and then bang!"

I'd say we don't have to wait for 2034, it's here today. Interesting write-up. I wholeheartedly agree with your statement that "... if they [traders of all types] believe something, you'll never convince them" of anything else. This is especially true of the retail crowd and their occult-like following from the myriad of gurus (ICT and Rob Smith come to mind - I was an acquaintance of Rob's and he truly believed of his intentions).

I would like to hear your opinion of the yield curve and its relevance to recessions as it appears we may be seeing a separation and a trend toward unity (if there is follow-through and the injection of liquidity ceases).

View attachment 332769

Hi Skychemist5,

Thanks for the comment

I don't really follow anyone online, so I have to sheepishly say that I've never heard of Rob Smith - I'd have to google him!

Re 2034 - I'm just highlighting when the cycle ENDS - although the cycle is UP (for the USA stock markets) there will be corrections within that time including a recession(s), which will for me, provide opportunities to buy low sell higher etc - If you look at the chart below the Gann Financial Timetable, 2034 +16-19 years will look like 1966-1982 and 2000-2016, namely at least 2 very very big crashes, followed by excellent buying opportunities

On the yield curve - I've only ever glanced at it, I understand that often its predicted recessions, but it failed in 2022 to do so, If that is all you look at - I've found over the years that all types of economic or sentiment based systems have flaws - my conclusions are its because of the cycle you're in at those times, so confirm the data and other cycles make it unreliable - personally, I look at the stock market, because its got a near 100% track record of predicting every recession going.

As the current long term cycle is UP (until 2034) then the tide is upwards, which means that its harder for adverse economic events to happen, I know this sounds Illogical, I would watch 2025/26 for some sort of economic event, which may or may not be confirmed by the traditional economic methods

As I mentioned, Interest rates aren't Important to me, which is why I hardly ever think about them - Keep watching the thread though as at some point (not sure when though) I'll forward project the US 10yr Yield composite Index I have, which will show the periods of peaks and trough expectations in the future - I don't plan to update prices though, but I can run the dates into the future which will produce the RED composite line

I'm not the type of chartist/analyst that considers economic information - For me personally, all I need are access to charts

I notice you use John Carters Squeeze - I met John at a couple of traders expo's, one in Las Vegas and the other in London, bought him a coffee, got him to sign my copy of his book and chewed the fat on trading - He was the speaker, I was a trader visitor to the expo's - Great guy John is

THT
 
I notice you use John Carters Squeeze - I met John at a couple of traders expo's, one in Las Vegas and the other in London, bought him a coffee, got him to sign my copy of his book and chewed the fat on trading - He was the speaker, I was a trader visitor to the expo's - Great guy John is

THT

That's fantastic! ... I've spoken to John over the phone and via chat regarding his SimplerTrading company. I've taken his idea behind the TTM and (like some overzealous techno geeks) have re-mastered it to my liking (it's more sensitive and identifies additional "intensities" of a squeeze). I'm in hope to visit his offices in TX in the future.

We seem to differ in that I do consider economic information, and the cycles I most note coincide with the release of such. I'm sure I'll have countless questions about your insights. I am only loosely familiar with Gann, so forgive my ignorance (I've spent more time with Granville which is simplistic).

You'll find lots of web references for Rob Smith. Unfortunately, he passed away this past year. He was purely a price action strategist. Awesome trader. I have some videos of his somewhere. I'll try to share them here once I find them. ... just keep in mind he is not an educator.
 
  • Like
Reactions: THT
That's fantastic! ... I've spoken to John over the phone and via chat regarding his SimplerTrading company. I've taken his idea behind the TTM and (like some overzealous techno geeks) have re-mastered it to my liking (it's more sensitive and identifies additional "intensities" of a squeeze). I'm in hope to visit his offices in TX in the future.

We seem to differ in that I do consider economic information, and the cycles I most note coincide with the release of such. I'm sure I'll have countless questions about your insights. I am only loosely familiar with Gann, so forgive my ignorance (I've spent more time with Granville which is simplistic).

You'll find lots of web references for Rob Smith. Unfortunately, he passed away this past year. He was purely a price action strategist. Awesome trader. I have some videos of his somewhere. I'll try to share them here once I find them. ... just keep in mind he is not an educator.

There's no right or wrong - just what works for you - I was at a major fund management group on D-Day 2008 (as a guest at a conference) and they didn't see the crash coming, that effectively was the catalyst for me ditching economic Information from the way I look at things - but if it works for you, use it

Again with TTM, there's no right or wrong, for me I don't use it because I'm more of a pullback trader, but whenever I see consolidation I always think "Squeeze" going on

Best traders are traders not educators - Sorry to hear his passing - I'll be showing a few price action strategies in the weeks to come

THT
 
The whole point of this game is to make money and more than you could do by just handing your funds over to a fund manager or tracking the market/sector of your choice

If you do not understand R values, expectancy or risk management then I would implore you to step away now and learn it - I'm assuming a working knowledge of it for what follows and I'm only going to show you LONG only positions, you can simply reverse the long rules to apply for shorting

If you get a REVERSAL at Time Cycle date I cannot tell you the confidence it gives you for the trade position - this is why I showed you that you can TIME the market at times, If it appeals to you, then research Hurst, Dewey etc

TRADE WITH THE TREND

and you will make money from the markets - This might seem obvious, but it is essential and simple

If you define a UP trend as a series of higher highs and higher bottoms, you will not go wrong - any deviation to this basic analysis and it may no longer be an up trend, the options will be a correction to the trend is happening or its the start of a new downtrend, which will then display a series of lower lows and lower highs

1060.JPG


Here's the same chart with moving averages of 10/20/30 & 50 periods (SIMPLE) - You can mess around with the different types of moving averages, but it doesn't do much to the bottom line - THERE IS NO PERFECT SETTING OR TYPE - ITS JUST DOWN TO PERSONAL PREFERENCE

1061.JPG


Here' s a swing chart or zigzag chart - which makes seeing the swings a bit clearer - again you can set what defines a swing such as price moving x% from the swing low/high etc

1062.JPG


Notice how often in the UP TRENDS a prior swing low is violated, then the trend resumes! For Instance in the chart directly above look at Dec 2020, Oct 2012 and March 2023 (others also happened, just not pointed them out) - This happens and can confuse to novice trader, as the expected series of higher swing lows and higher swing highs fails, then resumes

If you chase EVERY swing, you will find it hard going - Therefore it is BEST to pick your BATTLES that you have a fighting chance of winning

At this stage, some of you will be thinking "Elliott Wave" trading of the swings - If it worked for me I'd be trading it - Some of you might be able to work with it - it has its flawsthough and you have to be very careful of the Elliott Wave "experts" opinions, as I can tell you for certainty, some of those experts have been calling for the motther of all bear markets since 1986 and it still hasn't shown up!!!!!!!!

There is nothing wrong with combining swing charts and moving averages - this is the basis of my basic chart view - If it gets too cluttered so price gets obscured, I simply remove the moving averages or swing chart to be able to see price clearly, then once i've got a snapshot of that, I'll add the swings and MA's back in etc

1063.JPG


and I often keep the arrows on the chart to remind me of trend direction in the most stupidly simple form

These charts above have been of a randomly picked UK stock - LSE:MKS (Marks and Spencer) - I picked a stock to show the ups and downs

Below is a chart of the SP500 Index - as its an Index its an average of its constituents that form the Index

I've kept the swing file on and the MA's

1064.JPG


If you look at the far LEFT of the chart which shows the brilliant UP TREND from the March 2020 LOW to the Jan 2022 HIGH

LOOKING at just the SWING file swings of price (Ignore the MA's for this point)- Notice that the ONLY times 2 swing LOWS of the Swing File chart were violated were in April & August 2021, then the final TOP - I use a stop 2 swing lows BACK because when the trend ENDS and is no longer our friend, then it will rip out 2 and more previous swing lows

If you now look at the MKS chart in this post and apply the same technique, you'd lose a HUGE amount of profits by employing the same tactic, so you HAVE to come up with some RULE such as protecting a % of open profits if fast hard trending markets and when price is grinding higher slowly the 2 swing lows back stop could be employed etc - The main thing to realise is YOU are in charge and when the trend is over and a reversal in place then 2 prior swing lows will be taken out

In the SP500 chart, the trend reversal was a mini bear market that IS/WAS a correction to the trend

Now as trading strategies go - you can either buy the BREAKOUT of a swing or buy the pullback - either method would have worked in this example

My preference has always been to by the pullback in an uptrend, however, I do buy the breakout in certain circumstances, which I will show you later on in future posts in the thread

You might be thinking of using a moving average as your trailing stop this is fine, its not perfect, but no method is, just remember that a moving average of x periods will act differently depending upon the nature of the market trading, for example, in a really thrusting upwards moving market the MA line will be going up vertically, in a slower moving market it will have a less severe angle to it - anyway tinker and test and see what works best for you

You can even use Gann angles from swing lows to set a trend line moving average line (as Gann used to do) as the trailing stop

So to get a head start on me, If you look at those charts you can see how I define a trend, with the moving averages PRICE has to be ABOVE the MA's, especially the 10 & 20 as a minimum and then we're looking for PULLBACKS to enter

Its not that taxing, you don't need any formal qualification or degree to do this - but 95% of people who trade FAIL, because they get it wrong!

If there's any typos - this week my keyboard has been about 4 weeks behind the speed I type at, so apologies

THT
 
Saturday's post showed you TREND and how to figure it out - Easy Peasey style

If you believe that (back to belief systems!) the markets are random, then you are going to struggle to trust the concepts you use to determine things, such as trend, trailing stop losses, direction etc as you are going to always be second guessing yourself

If you are right, then you'll ride a trend, if wrong, you'll either make a few quid or get stopped out - This is why I showed you cycles, If you have half an idea of where you are in a cycle, then you can pretty much guess what ought to happen going forward

For example - Take the big 16-19 year cycle I believe shows an up/down sequence in the USA markets - in the UP phase we should see mild bear markets that are quickly overturned, so far to date I'm right, therefore I'm looking for signs that the correction could be over (2020 crash fell to a key geometrical % ratio of the high and bounced within a point of perfection and the crash/correction of 2022 fell to just past 50% of the bull market range from 2020-2022 but more importantly was an EXACT hit on Gann's 1 x 1 angle from the 2022 high) - I don't have a clue what the news or media were spouting out around those dates, but I bet they weren't looking for what I was looking for, namely a reversal point based on geometry

So far in this series, we've considered cycles & trends - we've not finished on these, but I want to make a quick pit stop to more hocus pocus jiggery pokery to open up your mind to geometry in the markets

This doesn't happen all the time, but it does happen when well defined trends happen - Again when you believe that the markets work out through grid systems that are mathematical and geometry, this becomes easier to see, think of and understand, especially if you're struggling to understand the swings of the market

The key to this is using the right moves

If your charting software moves the box/lines when rescaled, then the extension angle won't be correct - it is imperative that nothing rescales the extension angle

Find a market move that is well defined - In this example of the SP500 I've used the 2016 low to 2022 high - draw a Gann Box using those times and you get the box below

I've pre-set certain angles, vertical and horizontal levels of the box which create a geometrical gann box as shown

You can then extend one of the angles out - In this example you can see the 50% level of the BOX provided great support to the 2022 correction low - when used in connection with the true Gann Angle and 50% level of the 2020-2022 price range, this level stood out

Think about it, we forecast a high expected in Dec 2021, once price reversed from those highs within 1 point of perfection, it was pretty clear you [me] were onto something, so you could have then projected this Gann Box, the gann angles down from the 2022 high and the 50% range level and seen that they all met in a very tight area which highlighted TIME and Price, then you think back to Larry Williams 4 year cycle due in 2022 and in OCT and you have a pretty convincing picture, that very very very few people in the world would have known about or noted on their charts

1065.JPG


To show you this is no fluke

This is the WEEKLY chart of the MKS UK stock shown above in the TREND post

This time a different angle and % of the box was linked to price action

1066.JPG


Here's a few more examples - the HARMONICS of the Gann Box will show up often in future price action - This in itself PROVES markets are not random

1049.JPG


1011.jpg


1010.jpg


You'll get the same angles if you simply COPY or REFLECT/REPEAT the Gann Box into the future as shown here on the SP500 and Forex market:

990.JPG


984.JPG


We'll get back to the simple stuff from now on, but now you'll have an idea of why price action bounces around so much, sometimes it just HAS to hit certain levels before it will move

Also notice that the vertical levels sometimes turn into TIME CYCLES for the new box

THT
 
Ok, so back to simple basics

I'm leaving BOTH the Swing file and Moving Averages on the charts (same settings as prev mentioned 10/20/30 & 50 SMA's)

To determine TREND

We want PRICE to be ABOVE the moving averages and for the swing file to have rising (higher lows and higher highs) swings

When everything lines up we then want to trade in the direction of the perceived trend

The chart below [SP500 DAILY] provides a great example of bull and bear sections of the market

The ANGLE/PITCH/SLOPE of ascent of the moving averages are also Important, as this helps you to see price action strength and
momentum - although you can see this off price action itself in the chart below

1067.JPG


Its always good to see how price acts during uptrends and downtrends - I'm just focusing on the uptrends in this thread for the time being

Notice how the moving averages supported price on the pullbacks- I know moving averages are lagging Indicators but there's no denying the
support they provide in trending sections - In reality price moves and drags the moving average up, but you can clearly see that price
nestles nicely around the 10, 20 & 30 SMA's at various stages of an uptrend

We want to be BUYING these pullbacks as EARLY as possible in a potentially new up trending section - then you can work out trailing stop strategy and further purchases if the trend continues

Notice on price action and the swing file that when a uptrend starts there's a rally off the LOW, then a small correction that forms the 1st
HIGHER LOW, as long as price is on or around the SMA's and the range of the price bar is not excessive, these are ALWAYS a buying
point - I've labelled some not all of those points in the chart below (1 -2) - note that the uptrend off the Oct 2023 correction was so strong that this didn't happen - This is RARE and is where i would buy the BREAKOUT rather than the pullback, because no pullback happens to buy!

Commit price action of this rally to memory because when this happens and the price stutters in a laboured crawl UPWARDS then you
can by the BREAKOUT - What is happening is there is so much buying momentum that price just can't pullback and correct, so it grinds
itself higher, eventually breaking out to new highs as you can see - One thing is certain price CANNOT maintain this angle of ascent forever, so in the weeks/months ahead expect a period when price "recovers" This could be a correction downwards or maybe just sideways etc

1068.JPG


When you trail a stop up on a market, you need to decide if you do it the 2 swings back option, to give price chance to move around or
whether you pop in and out of the position - only YOU can know what suits you best and you need to have made that decision BEFORE you enter the position ideally

Sticking with the swing file chart - I mentioned previously how Gann and Livermore traded - It was nothing more than watching these swings and trading them based on the assumption of what price should do in a trend and buying the breakouts of the prior swing when price was correcting - If you want extra material research Ross Hook and the 123 method, its truly easy and simple

So for Gann, in his basic trading model and this applied to Jesse Livermore too - they just bought based on the SWINGS - They knew that following a DOWN TREND there should be a rally followed by a pullback where the low of the pullback did not exceed the low of the final low point of the preceding down trend and then they looked to go long either during the pullback or on the break of the prior swing high
(Gann did other things too, but we'll look at those another time)

They BOTH used BIG leverage though, which is how they made their gazillions and Gann had a greater insight to the markets than what we know today, but that is another area and one that most other people have failed to crack properly for over 100 years

1069.JPG


So we know TREND and how to find it, we know when to join it - you could just trade price action but if you want further confirmation, then here is what I've found helps

Lets look at using an Indicator in our analysis

Remember ALL Indicators do the same thing they MEASURE price CLOSES over x look back period of time but the maths to create the Indicator can differ - but basically with most Indicators we are measuring momentum of price action

This chart shows RSI with a 14 period look back period - you can use this setting to "read" the market

DO NOT USE RSI as explained in general books or by YouTube people - you WILL go bust

The main things to note with the 14 RSI are:
  1. During UPTRENDS the 14RSI reading is often 40%+
  2. and price REVERSALS often happen around the 40% level as an extreme
  3. During DOWNTRENDS the RSI readings are often UNDER 60%
  4. and price REVERSALS often find support around the 30% level
  5. DIVERGENCE is when price makes new extremes but the Indicator doesn't (see explanation below)
You can roughly gauge these by looking at price action and the chart below - these levels are NOT perfect, if you look on other charts you will find exceptions to those rules, but in general that is what 14RSI does and this can help you to trade and made trade decisions

DIVERGENCE = OCT 2022 LOW, price made a low but the Indicator didn't & Jan 2024 Price is making new highs but the Indicator isn't ( A top is in the offing!) and Oct 2023, price made new lows but the Indicator formed a double bottom
If these swings are nice and pronounced they can be traded

WORKS on EVERY MARKET and EVERY TIME-FRAME


1070.JPG


For the time being just learn and observe this stuff - In future posts, I'll show you in action EXACTLY as I have used it for the past 14 years

Also IF you cannot READ the market - DO NOT TRADE - ONLY trade when you can have a HIGH PROBABILITY of what the market should do next based on all the facts and Information displayed on the chart - For Example - Lets say price is making new recent swing LOWS within a previous up trend, the chances are that this might only be a correction to the up trend, the ONLY trade you would take would be if and only if 14RSI divergence was seen, if no divergence, then you simply WAIT until a formation shows up that IS tradeable

THT
 
In the last post I Introduced an Indicator in the 14RSI and how I use this Indicator to help ascertain trend direction of price, based on where the 14RSI is in terms of its % number in the Indicator window - Some people will trade based on the 14RSI - This is FINE as long as you know the limitations of the Indicator you are using - If you make money trading rather than the 95% of traders who don't then whatever your method, IS GOOD

In the chart below I've stacked multiple different Indicators on top of each other so you can visually compare

Although they are all calculated slightly differently, they all show price momentum in various guises

I'll go through my favourite ones in a further post later on - as there's no point having too many Indicators on the chart!

Remember IF PRICE is RISING then the Indicator line will angle UPWARDS to some degree - this will happen to moving averages too

This MEANS (LAW of the markets) that you can create a load of rule based rules for trading - there is NOTHING stopping you from adding in a bit of subjectivity if you are confident enough in your reading of the market

Notice the DIVERGENCE on the Indicators (Don't use 2RSI for divergence) - Price action WAS BEARISH, price was BELOW the MA's and the MA's were sloping DOWNWARDS, BUT, all the Indicators showed a pronounced BULLISH Divergence

Buying the bottom (depending on your rules) in this case was PERFECTLY feasible and turned into a great trade

Notice right now those same Indicators are not supporting the markets rise higher - this is a WARNING that a top of some description may be forming (Separate Timing methods I use are highlighting Feb to be a possible high too) But trade what you see, not what you think

Anyway, you can see that multiple different Indicators basically all do a similar thing

The Indicator names DTstoch is a proprietary Indicator of the software package - It basically double smooth's a stochastic Indicator, giving a smoother line - One thing you can do with good Indicators like this is pluck out market CYCLES that the market is moving too - these are easier to find and see when price moves SIDEWAYS across the chart in a trading range - on the chart are 2 different look back periods shown in the same Indicator window

The key to all this is finding which Indicator suits you and your style of trading (If you need to use an Indicator) and the reason you use an Indicator is for it to provide a greater than 60% win rate with multiple R value returns

1071.JPG
 
In this post, keeping with the theme of INDICATORS

We can use Indicators to TRACK MARKET CYCLES - DO NOT be scared to tweak Indicator values to "fit" market action - they pick up the natural cycles of the markets

In the chart below, I've changed the Indicator settings - you do NOT have to keep the default settings

Do you know why RSI is set/defaulted at 14 periods? Welles Wilder (the creator) set it as 14 days because that is 50% of the MOON cycle! He was using the Indicator to track moon cycles

All I've done here is take a 6 week (30 trading bars look back) CCI and then found 2 market LOWS that coincide with the Indicator low extremes and hey presto, we have a pretty accurate cycle found that coincides with extreme Indicator lows which can be used as the basis of a TRADING PLAN/SYSTEM

Its NOT perfect and never will be, but lows that are turning points occur right around (within a few days) the timing date

1072.JPG


Looking at/researching JM Hurst and Walter Bressert would not be a waste of your time

The chart below is a WEEKLY chart of the SP500 Index

Look at how well the Indicators warned you that crashes and plunges were bottoming out when they crossed the lower limit % lines - Just take a minute to think how stupidly simple this is to then formulate a plan that can be exploited financially to your benefit

1073.JPG


Now you have to set these things up for yourself, but just to show you its no fluke, here's a couple of more charts - you wait for the extreme Indicator reading and then WAIT for price to confirm and then you follow the TREND on whatever time-frame you want to

As well as looking at the extreme -300 reading on CCI, notice the reversals at the -200 CCI readings too!

Chart below is a FOREX chart

1074.JPG


Now before you think this is 100% certain and fool proof, here's a curve ball

This is an ETF of GOLD - This is WHY you don't and can't just blindly buy the Indicator extreme reading - 2 years AFTER the extreme reading of the CCI Indicator the market finally made its bear market low to form a new trend

1075.JPG


Notice again how the Indicators apart from the 2RSI help you to understand and know what TREND you are in and its support levels

Think of this, here is a chart of a UK based stock - RIO TINTO - I could show you 2009 and 2020, but we all know lots of stocks made extremes at those times, this chart shows other times extremes of -300 on the CCI were made - Some of these moves if you play it right can make you a fortune and other ones that don't seem to work, still make you a decent wedge, but just as Importantly, WHEN the extreme reading does not result in a straight out reversal and the market continues to fall, you KNOW that in the months ahead, it WILL bottom and reverse in a high probability situation that results in many many tens of % gain - which when used with how you determine TREND as seen in the charts, you can exploit to your advantage
1076.JPG


I've lost count how many times I've exploited this over the years - but you HAVE to incorporate this into a trading plan that assumes the extreme Indicator reading is NOT the final low and if it turns out to be the final low then its a big bonus - as you're trading on LOWER time-frames then you can benefit from lower risk etc

The main thing to consider is that you can use the Indicators to TIME the market, as a filter etc - In ALL these examples, of the WEEKLY chart and extremem -300 readings in CCI you would of made money on EVERY signal if you employed a lower time-frame entry system/method - some of those moves were mild to average but a few of them were exceptional
 
As you can see and I've not detailed my methods in full as of yet, I cover a wide range of topics relevant to the trading & Investing brigade - but going to take a detour in this post, its going to be short, but could be quite Important:

The condition that caused the Oct'23 RALLY in the USA markets, SQUARES OUT very early Feb'24

Traders should be on high alert for a reversal to the trend of some sort

As the overall trend is UPWARDS, any such correction should be short-lived, but these square outs can be quite powerful - anyway it should offer trading opps down and then back up, especially in the USA markets
 
Here you can see the WEEKLY RSI strategy in practice

On the WEEKLY Time-frame I use a 13 Week RSI setting

13 weeks very simply is 25% or a 1/4 of the year (52 weeks) - nothing more exotic than that I'm afraid, if you want to categorise it, then you could say its 90 degrees of the Sun Cycle (52 weeks / 90 degs = 0.5777 = Tan30) back to maths again!

What we want here is a 13RSI reading less than 25% and then we are on high alert for BULLISH trending action

I've highlighted in the chart below those times when this happened - its not regular!

AS we do NOT know if this <25% point represents the turning point or just a slowing down of the momentum, we have to have a trading plan based upon it - The main thing is we are AWARE of a possible bottom - the rest of the Investors don't have a clue what is going on

1077.JPG


This next chart zooms in to the most recent <25% 13RSI WEEKLY chart hit

Very aggressive traders could have bought the reversal low bar

More cautious traders would have bought the 1st PINK up arrow shown, as price price showed a clear potential reversal had been made, price was snuggly above both the 10 & 20 WEEK Simple Moving Averages and forming a Flag type formation - a break of the high would be a go long signal - Note the 13RSI was above 40 at this point too, which is in the support zone

The Initial STOP went 1 point below the lowest low bar of the FLAG formation pattern

1078.JPG


As you can see the SMA's moved into proper bullish order and are still doing do, giving more chances to buy in marked by the pink arrows on the WEEKLY chart

Note: - GREAT places to buy are WHEN price snugs the 10 SMA and when price slips into the zone between the 10 & 20 SMA smoothly - If you look at the 3rd pink arrow on the chart above, Notice the very narrow bar, those types of bars are your Christmas and Birthdays rolled up into one because you can buy lots more stock for the same risk (Keep note of this idea for the post I'll make on Entry, Exit and Risk later on in this thread)

Here's the DAILY chart from the Oct'22 low, which shows the finer detail of the trend

Note we always BUY during a pullback in a presumed UPTREND - Note the 1-2 swings previously mentioned - numerous opportunities arose on the DAILY chart to join the trend long

1079.JPG


In this particular stock - I had a core position based on the WEEKLY chart, so the trade was managed based on the WEEKLY chart, but I also dove in and out on this DAILY chart as and when no-brainer opportunities arose - such as May, July 2023 and Dec 2023 to name a few

In the big grand scheme of things, this stock became unloved by all the big funds, they dumped it over the years and now when it bottomed near £1 they've piled back in again as they've realised it was too cheap for a high street staple, therefore creating a beautiful uptrend that us traders can trade

This would also be a lovely Buy & Hold position to take on

As you can see, it began with the 13RSI trigger, then price formed TRENDING movements - This is what you are looking for on the 13RSI <25% triggers - This is picture perfect, now you know in the trading world little is picture perfect, so drill down into the 2008/09 13RSI <25% trigger and see what happened there, Assuming you had no clue about the 16-19 yr cycle you'd of had a couple of losses, if you knew of the 16-19 yr cycle, you would be looking to short the markets not buy them long - see how it all clumps together
 
Top