Hi folks,
This is a very simple strategy for trading GBPUSD that I want to share with you; I have backtested it for 3 months (sadly this is all the data I have available in the charting system I use), over which time it generates, at the moment, a very good profit. (8470 euros in three months if you stake 5 euros per point; admittedly there is a hideous 3400 drawdown at one point, but this is due to the over-simple script version of the strategy making a series of ridiculous trades that I don't think a human being would make; and even then it comes out with a big profit).
My hope is that by combining this too-simple strategy with such things as support, resistance, price action and common sense to filter out bad trades, an extremely good income might be generated. Or not ... time will tell, since I am now playing this strategy for real (as of three weeks ago) and have so far won with it.
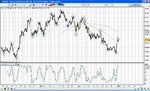
The strategy uses a four-hour-bar chart; it doesn't work in other time frames or on other currencies. You need to be able to check the chart at least every few hours. The idea is simply to short GBPUSD whenever the stochastic indicator registers over 80 and buy it whenever the stochastic is less than 20. Exit as soon as the stochastic moves to the opposite extreme. The stop loss is always 40 points; this gives the best results in my backtesting.
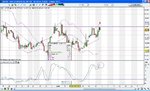
Now, if you look at GBPUSD on a 4-hour chart, it seems to be generally very volatile. (Unless this is just the case for the past 3 months!). It's full of turning points, many of which I've circled on the attached chart which you can hopefully see.
The stochastic helps enormously to figure out where these turning points are; as I say, over this period, if you simply bought and sold according to the stochastic alone you'd come out with a big profit. But I imagine that, if you leave some of the possible trades aside by insisting that
a) The price must be showing signs of reversal
b) The price must currently be at a support or resistance level and
c) Avoid trading against any strong trend where such a trend is obvious and there is no good reason (such as fundamental considerations) for thinking the trend will fizzle out pronto
... .then perhaps this strategy could be highly lucrative.
What I like about it is that there are a limited number of points when a legitimate trade can be made; it is then simply a case of trying to filter out the bad ones to minimise losses. The script actually loses 66% of the time, and yet wins overall; the winning trades tend to be pretty large.
A 40-point stop-loss at 1 euro per point costs you 40 euros; but then a single winning trade might easily make 200 or more, as you can see from the chart. So really you're using up these 40-euro "bullets" gunning for those big hefty reversals.
I'm not pretending there's anything magic or original about this; I'm only trying to apply what I've learned from forex books. After a few months of looking at various charts and trading in various time frames, I've decided to concentrate all my efforts on this one.
Right now I have money on GBPUSD going down; that's because it fits all of the above criteria at the time of writing (at the rightmost position on the chart I've attached to this post) and I'm hearing a lot of bearish sentiments about the UK economy. If, of course, GBPUSD now instead surges upwards by 500 points, it'll just about wipe the floor with me since I'll keep expending 40-point stop losses only to have them tripped ... but of course that's why I ought really to be trading 1% of my tiny account, not 5% as I am currently.
Any feedback welcomed ....
Boletus
PS
This is a ProRealTime script for anyone who can use such a thing:
stochasticFast = Stochastic[21,3](close)
conditionGoShort = stochasticFast > 80
conditionGoLong = stochasticFast < 20
conditionExitLong = conditionGoShort
conditionExitShort = conditionGoLong
if conditionGoLong then
BUY 1 SHARES AT MARKET THISBARONCLOSE
elsif conditionExitLong then
SELL 1 SHARES AT MARKET THISBARONCLOSE
endif
if conditionGoShort then
SELLSHORT 1 SHARES AT MARKET THISBARONCLOSE
elsif conditionExitShort then
EXITSHORT 1 SHARES AT MARKET THISBARONCLOSE
endif
This is a very simple strategy for trading GBPUSD that I want to share with you; I have backtested it for 3 months (sadly this is all the data I have available in the charting system I use), over which time it generates, at the moment, a very good profit. (8470 euros in three months if you stake 5 euros per point; admittedly there is a hideous 3400 drawdown at one point, but this is due to the over-simple script version of the strategy making a series of ridiculous trades that I don't think a human being would make; and even then it comes out with a big profit).
My hope is that by combining this too-simple strategy with such things as support, resistance, price action and common sense to filter out bad trades, an extremely good income might be generated. Or not ... time will tell, since I am now playing this strategy for real (as of three weeks ago) and have so far won with it.
The strategy uses a four-hour-bar chart; it doesn't work in other time frames or on other currencies. You need to be able to check the chart at least every few hours. The idea is simply to short GBPUSD whenever the stochastic indicator registers over 80 and buy it whenever the stochastic is less than 20. Exit as soon as the stochastic moves to the opposite extreme. The stop loss is always 40 points; this gives the best results in my backtesting.
Now, if you look at GBPUSD on a 4-hour chart, it seems to be generally very volatile. (Unless this is just the case for the past 3 months!). It's full of turning points, many of which I've circled on the attached chart which you can hopefully see.
The stochastic helps enormously to figure out where these turning points are; as I say, over this period, if you simply bought and sold according to the stochastic alone you'd come out with a big profit. But I imagine that, if you leave some of the possible trades aside by insisting that
a) The price must be showing signs of reversal
b) The price must currently be at a support or resistance level and
c) Avoid trading against any strong trend where such a trend is obvious and there is no good reason (such as fundamental considerations) for thinking the trend will fizzle out pronto
... .then perhaps this strategy could be highly lucrative.
What I like about it is that there are a limited number of points when a legitimate trade can be made; it is then simply a case of trying to filter out the bad ones to minimise losses. The script actually loses 66% of the time, and yet wins overall; the winning trades tend to be pretty large.
A 40-point stop-loss at 1 euro per point costs you 40 euros; but then a single winning trade might easily make 200 or more, as you can see from the chart. So really you're using up these 40-euro "bullets" gunning for those big hefty reversals.
I'm not pretending there's anything magic or original about this; I'm only trying to apply what I've learned from forex books. After a few months of looking at various charts and trading in various time frames, I've decided to concentrate all my efforts on this one.
Right now I have money on GBPUSD going down; that's because it fits all of the above criteria at the time of writing (at the rightmost position on the chart I've attached to this post) and I'm hearing a lot of bearish sentiments about the UK economy. If, of course, GBPUSD now instead surges upwards by 500 points, it'll just about wipe the floor with me since I'll keep expending 40-point stop losses only to have them tripped ... but of course that's why I ought really to be trading 1% of my tiny account, not 5% as I am currently.
Any feedback welcomed ....
Boletus
PS
This is a ProRealTime script for anyone who can use such a thing:
stochasticFast = Stochastic[21,3](close)
conditionGoShort = stochasticFast > 80
conditionGoLong = stochasticFast < 20
conditionExitLong = conditionGoShort
conditionExitShort = conditionGoLong
if conditionGoLong then
BUY 1 SHARES AT MARKET THISBARONCLOSE
elsif conditionExitLong then
SELL 1 SHARES AT MARKET THISBARONCLOSE
endif
if conditionGoShort then
SELLSHORT 1 SHARES AT MARKET THISBARONCLOSE
elsif conditionExitShort then
EXITSHORT 1 SHARES AT MARKET THISBARONCLOSE
endif