Could someone explain this perhaps with a graph and how/when you would prefer to trade it? I can see an inverse head and shoulders on the daily, but the head is small (not sure how significant that is).
I read somewhere that inverse H&S requires high volume for the reversal compared with normal H&S. Any thoughts?
Hi UKSnowman,
Sorry I didnt add more explanation.
Forget head and shoulders etc on this one, it can be much simpler.
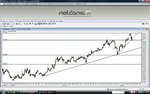
Get your daily chart up of the nasdaq or USTech100.
Now, do you see the daily highs made on 6th jan and 9th feb / 10th feb?
If yes..... what price was the high?
What was the low of today?
What did it do at the low of today?
Answer - bounced off the low of today which was the high of those 3 days.......
For me........ that's a buy signal on the price action alone, whether it is head and shoulders, inside armpit or five knuckle combination...... it doenst matter to me. It is a big fat buying opportunity.
Some of the more pattern recognition guys will hopefully be able to help you out with the h&s part...
Sorry again for lack of clarity. I only have time to post quick "heads ups".