Nothing special, just analysis

S&p 500

Near a top. I don't think that long positions are appropriate. I already closed mine and I'm waiting for the reversal.
 

Attachments

  • s&p_060110.jpg
    s&p_060110.jpg
    62.3 KB · Views: 245
DJ Euro Stoxx

First signs of a renewed bear market.
 

Attachments

  • djeuro_220110_d.jpg
    djeuro_220110_d.jpg
    77.3 KB · Views: 238
  • djeuro_220110_6h.jpg
    djeuro_220110_6h.jpg
    80.2 KB · Views: 215
Dow Jones Industrial Average

Nice technical figures. Good bullish opportunity, which in Elliott wave count is expected to e a corrective pattern.
 

Attachments

  • djia_280110.jpg
    djia_280110.jpg
    61.6 KB · Views: 256
Ftse

The first chart shows our forecast on FTSE from last Wednesday. The second is showing where we've got by now.
 

Attachments

  • ftse_260110_1h.jpg
    ftse_260110_1h.jpg
    79.6 KB · Views: 241
  • ftse_030210_1h.jpg
    ftse_030210_1h.jpg
    59.1 KB · Views: 228
Djia

The following chart is part of a Financial Report, posted on the web site. It shows my mid term perspective about the world's major markets, such as GOLD, US Dollar, and Crude Oil.
 

Attachments

  • djia_070210.jpg
    djia_070210.jpg
    93.6 KB · Views: 234
Djia

Target reached for those of us, who moved the stop at the top of wave ii.
 

Attachments

  • djia_230210_fin.jpg
    djia_230210_fin.jpg
    71.6 KB · Views: 190
Nasdaq

The best trading opportunities come with third waves. But to be able to use them, we should have a clear perspective on all time frames.

I've been often ask how do I recognize third waves in all the market noise. The answer of that question is not simple. You can see third wave basicly in all time frames. They are the most volatile price actions, often surprising (especially for fundamental analysts) and always in the direction of the trend. Third waves develop on every time frame, but to be confident of a coming third wave, you should have a clear Elliott wave analysis on all time frames. How to forecast and to trade third waves. Well, I guess it is a matter of experience. It takes time for a trader to get used with the Elliott wave rules and patterns.

That forecast was published on Monday this week. It showed a coming intraday third wave on NASDAQ. Couple of hours after the forecast, the market hit the profected target.
 

Attachments

  • nasdaq_220210_15m.jpg
    nasdaq_220210_15m.jpg
    65.1 KB · Views: 171
  • nasdaq_230210_fin.jpg
    nasdaq_230210_fin.jpg
    67.8 KB · Views: 159
Djia

How a professionally made Elliott wave analysis can tell you where are the appropriate levels for stop loss and where is dangerous to be aggressive?

It is all connected. If you watch only 15 minute chart and you try to find good opportunities on the market, you may become victim of your own analysis and forecast. Why ? Because wave principle explains the market psychology as a fractal structure. Understanding of this is one of the most difficult things for an Elliott wave newbie. To have confidence that market is giving you good opportunity on a 15 minute chart, you should have confirmation for that opportunity on a 4 hour chart, 8 hour, even on a daily chart. If not, you may fall into one of the very market traps. Kind of such a trap we had this week with DJIA (Dow Jones Industrial Average). It was quite a tricky situation when a lot of market technicians expected that the market will fall again on a intraday frame and they have putted their stop loss at 10,450.0.

Then we published a forecast (chart 2).

As you can see, the resistance line was exactly at the levels where a lot of people usually set their stop loss. But in this case that would have been quite a mistake. And that is what we said to our subscribers. Take a look what happened two days later (chart 1).

The market did break that resistance line, then turned it to a support line, and then eventually has reached our target at 10,550.00.
 

Attachments

  • djia_070310_fin.jpg
    djia_070310_fin.jpg
    73.6 KB · Views: 175
  • djia_020310_1h.jpg
    djia_020310_1h.jpg
    70.6 KB · Views: 166
S&p 500

Why a new high should make you stay cautious and not surrender to the extreme optimism ? Answer is given by the Dow Theory.

On March 12, S&P 500 made a new high, surprising lots of technical analysts. The paradox is that some of them are now blaming technical analysis that it had lied traders and investors with its bearish perspective. Pople who blame technical analysis and Elliott wave theory at this moment are the ones who have very bad risk management and money management of their trades. In addition to that - technical analysis will give us the answer why the market is trying to confuse a lot of people, and in which direction the primary trend actually is.

The answer is hidden in conventional Dow Theory. He said - I don't go for a bull market if I don't have new highs in the three major (at that time) stock indices - Dow Jones Industrial Average, Transportation and Utility. If only one of them is making a new high, but the others are not, stay cautious and wait for a reversal.

Have in mind the Dow rule. We'll get back to it in a moment.

Now, there are 3 major technical warnings about the widely proclaimed renewed bull market, and in particular about S&P 500.

1) That chart shows the price action from the March's low til now. Please notice the deeper devergence between the price and RSI. Even the new high is deverging the oscilator. That is a very serious warning that the trend is exhausing and it's near its end. (chart 1)

2) On that 4-hour chart we can observe the structure of the rally that exceeded the previous high. The market reached the channel's upper shoulder and to complete the sense of exhausting, has an intraday divergence with RSI. (chart 2)

3) Let's get back to Dow rule for the intermarket confirmations. While S&P 500 and NASDAQ did exceed their previous tops, DJ Industrial Average and DJ Euro Stoxx didn't. What does that tell you. Well, at least that we should not be very excited about the new highs. Be patient. The world's major stock indices are about to peak and to start moving in the same direction very soon. That's all we're saying for now. (chart 3 and 4)
 

Attachments

  • djeur_150310_d.jpg
    djeur_150310_d.jpg
    61.4 KB · Views: 171
  • djia_150310_6h.jpg
    djia_150310_6h.jpg
    58.1 KB · Views: 162
  • sp_150310_4h.jpg
    sp_150310_4h.jpg
    78.6 KB · Views: 170
  • sp_150310_d.jpg
    sp_150310_d.jpg
    71.9 KB · Views: 172
Cac40

I start a brand new ribric of articles, which will show you some real trades on the market. My own trades. I assure you that I'll show you also the mistakes and the positions that went to losses. They are innevitable. If you want to be on the market, mistakes happen. But this is subject of another articles. Trading psychology is complicated as much it's important.

On March 16 I saw the following intraday picture on CAC40.

As you see I opened long position. I had a target which I was looking for. Unfortunately you cannot see my critical level (stop order), because it didn't fit in the chart when I saved it, but my stop was some points below the bottom of wave iv. So, I had analysis, target and stop level. It was a little bit aggressive, because I expected the market to reach an important stop soon. Despite of that I decided to take advantage from this intraday opportunity. Let's see what happened next.

The market rallied. Immediately the stop is moved to the new critical level. In this situation I couldn't lose money. It feels good. But then the market decided to be tricky.

It fell almost to my stop. It was a tense situation. Of course thanks to my risk management I couldn't lose money and I was quite calm about this. And the market paid back. It rallied again.

In this situation, as you can see I decided to make the next step. I moved my stop to the next critical level. The only think I was waiting for was a breakthrough of the resistance line, because the market was quite tricky and it was not a good idea to be too greedy.

Here is it. I closed my position right after the breakthrough.
 

Attachments

  • cac40_160310_30m_trade_4.jpg
    cac40_160310_30m_trade_4.jpg
    59.7 KB · Views: 159
  • cac40_160310_30m_trade_3.jpg
    cac40_160310_30m_trade_3.jpg
    61.6 KB · Views: 160
  • cac40_160310_30m_trade_2.jpg
    cac40_160310_30m_trade_2.jpg
    66.9 KB · Views: 169
  • cac40_160310_30m_trade_1.jpg
    cac40_160310_30m_trade_1.jpg
    72.2 KB · Views: 160
  • cac40_160310_30m_trade.jpg
    cac40_160310_30m_trade.jpg
    57.3 KB · Views: 164
Ibex35

We're continuing the rubric Show me some Trade with the next
article, presenting the chronology of a short position that was closed this morning. But this time, we will make even stronger connection between a good technical analysis and the risk management that it gives.

The post consists lots of interesting chart. Read the full article here.
 
Indexes - Goldman Sachs...my asparagus

was it possible to foreseen the market fall ?
The answer, of course is YES. But let's start from the beginning. Today I was looking in the media about Goldman Sachs's fraud scandal and I found plenty of self repeating headlines, like...

"Stocks fall as Goldman Sachs charged with fraud" - Kansas

"U.S. Stock Futures Fall as Goldman Sachs Faces Probes in Europe" - Businessweek

"It was mostly smooth sailing for stocks during the first week of earnings until Friday, when news of Goldman Sachs' troubles with regulators cast over Wall Street a cloud of uncertainty almost as thick as the volcanic ash above Iceland." - MarketWatch

"The news dragged down broad U.S. equity indexes, which fell more than 1 percent." - Yahoo Finance.

The guys of course explain Friday's fall with the scandal. And in every article I found one pawky comment, that no one could have predicted that scandal and the immediate market reaction. With this I do not agree. And you know what, I have evidences that on Wednesday, some people were aware of the market's intraday reversal. All the charts and commentaries below are part of our Indexes Bulletin from Wednesday, April 14, just two days before the action. Take a good look, cause this is not a fraud, it's forecasting...

"NASDAQ - Near a reversal.
I have my reasons to think that the first major stock index that would reverse and lead others in the same direction will be NASDAQ. Be careful, to be long in this situation is not very wise."

"FTSE - New high, then reversal.
I need to see first a completed ending diagonal for wave c, and then I'll pay attention for possible signs of a reversal, like five waves in the downside direction. Appropriate target for the top of wave c at 5,862.91."

"DAX - Near reversal.
It is difficult to predict where the top of wave c will be, but I have my reasons to suggest that it will not be far from the previous high. After we see that top, I recommend you to be patient, because the market could reverse in five waves down."

The truth is that all these stock indices were ready to pull back. The reasons are psychological, technical. Goldman Sachs was just the trigger to that. Basically, there are two groups of people observing and participating the markets. The first that follow news and one day realises that is out of the game. Cause news are always late. So are the people. The second group of people is the so called technical analysts. They are capable of predicting markets actions before they occur. With that knowledge, they have confidence in their trading or investing decisions. And believe me, that confidence raises your trading account.
 

Attachments

  • nasdaq_140410_2h.jpg
    nasdaq_140410_2h.jpg
    72.2 KB · Views: 166
  • ftse_140410_1h.jpg
    ftse_140410_1h.jpg
    71.7 KB · Views: 166
  • dax_140410_1h.jpg
    dax_140410_1h.jpg
    70.4 KB · Views: 158
Ibex35

I admit that recently I started to follow the latest news and headlines from the financial media. Not because I think they have some influence over the markets, but because it is actually pretty funny for a guy who use wave principle in his trade to watch how majority of markets participants love to seek blame for changes in their attitudes and moods, reflecting on the market's trend . And since this has become literally a game of cat and mouse - which government will announce higher deficit or which credit rating will fall more. Honestly, that's a great fun for me, and I would like to give my own contribution to this "game . Only that my arguments are different. Because what actually happens in the nature of this game is something else. Traders and investors change their mood, the emotion that prevails is fear. It triggers the national stock market sales. That is how the fear becomes apparent. And because people love to design their fears on something ... we go outside to look for reasons for that indexes' suffered losses and bankruptcies, unemployment. So, dear readers, I proudly present my suggestion for the next crisis guiltt government - Spain.

A few words on the technical picture. If we see the confirmation of this bearish scenario, it is very likely to see the beginning of a longer-term collapse of the main Spanish stock index. This crash course would be accompanied by a sufficient number of scandals, failures of key sector corporations, very unpleasant social changes in the country. However, let's mention the two critical levels. If the markets breaks them, I will have to change the wave count. Especially important is the higher level - 12.280.

So, with this chart by your side, you will hardly be surprised by the headlines of decreased credit rating and increased budget deficits. And shall we blame Greece and Spain for the future bear market ? I don't think so. But this is subject of another more detailed article.
 

Attachments

  • ibex_290410_w.jpg
    ibex_290410_w.jpg
    62.2 KB · Views: 162
S&P - Opportunity behind the corner

There are rare opportunities that markets give us with almost 10% of risk. Well, it is of course a question of risk management that every trader has. But for me, things start with analysis and forecast. That is my way of trading and I think we're about to see one of the most intensive and volatile drops in stock market indexes, since the March 2008 bottom. It is a single chart that I want to show here. S&P 500.

sp_010610_4h.jpg


As you can see, I've already taken my short trade, near the 1,220 top, and don't intend to close that trade soon. But what is more important is that the wave structure shows that wave iii of iii is just around the corner. As you know, those price actions are the strongest and the most volatile. They literally identify the trend in different time frames. An other thing to notice is the various possibilities for critical levels, which determine the risk management. I do not want to tell which is the most appropriate. It depends on the temperament of every trader. As a good entry point I will surely point the confirmational breakthrough. That is a conservative approach to the Elliott wave trading, but I have to tell you - being conservative is almost equal to being richer on the markets.
 
What explains unrational turns?

While I was fumbling through my computer trying to find a classic caricature of Chuck Norris, I
came across something, that I admit I had forgotten. It doesn't concern only financial markets but also how we humans behave. How emotions guide our development. It is a simple chart, which, however, reveals how our emotions go from one extreme to another. On their way, they go through the so long studied, worshiped and calculated with bizarre formulas equilibrium. Economical, financial different social systems' equilibrium exists. It is a fact. It's only that it takes just as long as to feel it, to enjoy it and then to consider that it will last forever. And because our mind wants to see equilibriums around us, it is trying its best to deceive us that people are rational, and therefore, we strive for balance. It's just like human behavior can be predicted with some logical formulas and whoever has a Japanese calculator (like a brand new CITIZEN), he will win more money on the markets. That, basically is the idea of the professors in most of the universities of economics. Of course, they prefer to enjoy their theory without ever tried it in practice. We all know why.

Yet the reason for the human behavior is not rational but emotional. Our emotions flip from one extreme to the other and thus shape our reality. Speaking of extremes, let's get back to the chart.

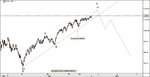
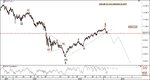
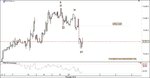
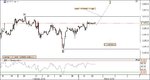
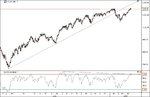
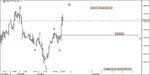
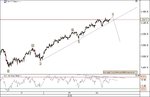
In February 2008 I published in several forums a forecast of one of the main indicators for the development of the American economy - Dow Jones Industrial Average. More interesting, however, is the reason that made me post my forecast. Just in those moment, sentiment indicators showed that over 85% of market participants believed that the market will continue to collapse. At the same time the media headlines were striking:

US cuts interest rates amid fears of global financial collapse - Financial Times

In general, any normal person who had trusted his professor in the university, would say that the situation is truly tragic and indexes will surely continue to fall. Surely, but no. That is exactly the extreme emotional state of the crowd, that warns of a coming reversal. Take a look at the chart.

djia_d_jpeg.jpg


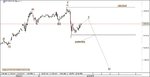
Near bottoms, the psychology of the crowd has same features every time - almost 100% of people are pessimistic, the media headlines suggest that the Armageddon is just a day in front of us, and the idea that the markets could reverse looks pretty much as science fiction to everyone. And just then, the market turnes its direction. In other words, my "absurd" forecast turned out to be exactly correct.

djia_130710.gif


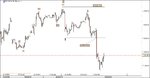
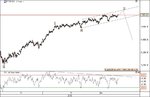
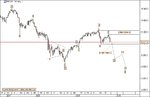
Near the peaks, the same crowd that has went the other extreme - the crisis is over and it can not be repeated again, as economic indicators are as brand new, Japanese calculators work with full energy, nearly 100% of all people are optimistic and media which is pushing forward to a statement of the Minister of finance, who says that the crisis is forgotten. But you know what follows when the crowd reaches one of two extremes - in the next moment it flips and takes the opposite direction.

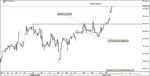
And as we observe these abstract chart with various lines and numbers on them, we explain what led to a decrease or increase the length of the lines, it is nice to remember something important. These lines actually represent the world's economical development. A long line down means that banks will not give you more loans, or that your private pension fund may disappear, or that your customers will disappear, that your business partners will start to cheat, you can have difficulties paying your mortgages, or that your wife will love you less. And nobody will be able to help you. Cause they will be in the same position.

Higher chart lines mean some good things with which we are used to. Optimism in the mass psychology takes much longer than pessimism. We all know how good we feel when we can use less efforts to live more comfortably.

I propose to be alert and worried that the chart lines will go lower. Unfortunately it is very likely
 
Believe it or not, the puzzle is not changed (DAX & DJIA)

World's major stock market indexes has made some interesting surprises these weeks, and that was enough for some analysts to point out that the crisis is over and all the pessimistic forecasts are gone for good. It's true that there are some changes in the details, but I want to clarify - we're far away from changing the perspective. And because I use technical and Elliott wave analysis, I want to share my critical levels and to warn you not to trust those enthusiastic "I-wanna be-bullish" statements on the media. As we all know, mass psychology doesn't care about media.

dax_120810_2h.jpg


Although the German DAX made a new high and all the related super optimistic headlines was thrown to the public, the perspective of the main German industry index is not very bright. While the market is below the critical level (6,393), we expect to see a market reversal which could be the beginning of a larger bear rally.

djia_120810_6h.jpg


On the other hand, we haven't seen a new high in DJIA (Dow Jones Industrial Average), similar to the one DAX made. The market, actually is still far from its previous top at 11,267, which we set as critical level for all current bearish scenarios. The wave count that we use as a primary is a pattern called leading diagonal. If the market stays below the previous top, and breaks the bottom of wave i, most likely will confirm a sharp downside rally.

So, instead of talking enthusiastic without observing the markets, we've just set two major critical levels for DAX and DJIA, which will eliminate the bearish perspective for a while. That's it. While the markets are below those levels, we look for an appropriate place to short the market. The best thing to do is to have enough confirmations using your trading strategy.
 
Nikkei

People's Republic of China but ahead of Germany at 4th. It may be interesting to observe whether the long going crisis in the land of the rising sun will end soon, or the opposite. Financial media are optimistic. But why isn't that surprising.

"Japan economy in surprise growth"
BBC Business NEWS

"Japan’s economy grew more than forecast in the third quarter as consumer spending increased, shielding the expansion from a stronger yen and export slowdown likely to have a greater impact this quarter."
Bloomberg

Now, let's take a look at the real charts and try to do some real forecasting. For the moment I see two different scenarios for the NIKKEI 225, Japan's overall stock market index.

nikkei_181110_d.jpg


Scenario 1 - If we consider the top of B to be at 11,448, then we can expect to see a renewed bear market rally, going below 5000 points. Critical level at the top of wave B.

nikkei_181110_d_1.jpg


Scenario 2 - It is very likely to see another rally with appropriate target at 13,280 for wave B, before the market reverses. That rally could be a good opportunity for intraday trading, because of the expected volatility, although it could be also very dangerous, because of the expectations of a top.

In both of the scenarios, the technical indicators that I use show a same perspective - primary bear market, started in 1990's and still not over. The only market breakthrough, that eventually can exclude both of the bearish scenarios is 18,342. Being an extreme optimist could dangerously harm your financials.
 
S&P 500 - Show me some Trade

All trading methodologies need to be proven by the market. It means that you need to test the system, so the market could confirm both the good and the bad sides of the methodology. Some have more bad than good effects and by that they lead to loss of money, or other side effects like psychological stress and disorder. In other words, if your trading methodology makes you feel tight and leads you to losses then you should reconsider its value for you. On the other hand, there doesn't exist a methodology or system, which works all the time, or one which is always correct. The perfect trading system is a myth. But there are ways to analyse and trade, which reduce the risk to a possible minimum and are efficient in both market directions - upside and downside. One of those ways is the methodology that I use and name THE THIRD WAVE TRADER. To see how it works, I decided to show you a brief description of a real intraday trade, that I made two days ago.

On December 07 I saw five waves down on a 5-minute chart of S&P 500, followed by a three-waves correction. I thought that this could be a nice intraday opportunity to take some points over the night and I set my sell stop order a few points above the bottom of wave i or a. I was convinced at that time that if the market hit my sell stop order, it would confirm that wave iii or c is under development. As you know, third waves are usually the strongest, fastest and most volatile price actions, which defines the trend in the different time frames. Almost the same characteristics apply for c-waves. So all I had to do was to wait for the confirmation. See what happened.

sp_081210_10m_tr.jpg


The market made my sell stop order a living short trade and after a shallow correction, started to go lower. My first stop loss level was at 1,233.48, but after the market started to fall fast I moved it at 1,226.65. A few hours after that I decided that wave iii or c is near its end and I closed my trade manually. Notice that the market reached exactly 261.80 of wave i or a. That was one of the signs that made me think that keeping the trade open isn't such a good idea. And so I closed my trade with about 10 points profit for a few hours. But the rules that I followed are part of the THIRD WAVE TRADER system, which gives me the comfort of trading with minimum stress and risk.
 
Top