New Version Ichimoku Charts

Nildes

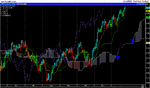
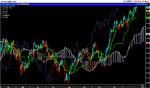
No the point i am making is that if we take two lines in question - regardles of periods applied or used - will never plot the same....

One line - Kijun-sen (standard line) is a moving average...and is calculated in one way...

The Span A line is calculated in a different way as mentioned in my post....

So technically these lines should plot different, bacause one line's figures are used to calculate the second line....and if span line is plotted incorrectly then it will give a wrong span of kumo (cloud)...But in your chart they are the same - carbon copy...

So Span A line appears to plot incorrectly in Updata's charts...

Updata's kumo span is a lot different than MS chart...

Hope i am making some sense.....
 
Last edited:
Hi Zambuck,

To paraphrase Graham Green: what you’re really asking is why are there cloudless skies in my chart? Sometimes, but not always? :)

Good question and I’ll come back to you: but not necessarily today. :(

Cheers

Mayfly

PS: Cloudless= the points between the blue arrows on the attached chart?
 

Attachments

  • S&P 500 INDEX.png
    S&P 500 INDEX.png
    29.6 KB · Views: 401
Last edited:
Hi Mayfly

No I am not asking why are there cloudless points as on your chart.....

On your charts, I am saying, that the OFF WHITE or CREAM coloured SPAN LINE defining KUMO will never be a carbon copy of STANDARD LINE - GREEN LINE - on your chart, because the farmulae to calculate these are different....Yet only thing Updata has done is copied the Standard line and shifted it few days and called it span line...

STANDARD LINE - GREEN LINE is a MA, while SPAN LINE is calculated using the plot of STANDARD LINE..

So technically these will plot diferent

The formulae to calculate OFF WHITE SPAN LINE is...

GREEN LINE (STANDARD LINE) + YELLOW LINE (TURNING LINE) / 2, and plotted 26 days ahead including today....

So if you take reading of GREEN LINE and YELLOW line plots say on 9 Nov, and use the formulae above, then OFF WHITE LINE will plot that value on 15 Dec.....But Updata's chart plots this incorrectly...Metastock plots this correctly...

Sorry I am not shouting by using capitols, but am highlighting the points....

Hope this makes sense....

When you ask Updata , just ask for the formulaes used to calculate the span lines....

Very interesting discussion, but I may be off later today as it's her indoors birthday.....

regards
 
Last edited:
All very interesting. I have done a lot of reading and research in the last week and it seems there is no right and no wrong way to calculate the Spans and therefore the clouds. It seems that the guy who invented them didn't tell anyone so people have speculated on what the calculations are. Some say the cloud must be plotted forward and say it shouldn't. Seems metastock has decided not to and updata has decided to. I think having the cloud go forward is very helpful. Some don't plot the chikou or lagging span at all but I believe that is the most important line. It may be that all methods are valid and that metastock is not wrong when it gets the lines round the other way and updata is not wrong with its span calculations.

Some calculate tenkan and kijun as moving averages and some calculate them as the midpoint of 9 and 26 sessions (this seems to be the majority opinion).

Lastly, no-one can agree of how to spell the name of the charts. I have seen three different spellings.

Ichimoku Kinko Hyo
Ichimoku Kinkou hyou
Ichimoku Kinkou houyou

So far by testing has revealed the charts to be very useful. I need to start varying the calculation now.

Now where did I put those sprouts? :)

Cheers
Chris
 
Chris...

The formulaes of these chart do exist and in fact a person actually holds a copy right of that charting method as well...!!

The main point I am still making is that Span A line should never match kijun-sen line because both are constructed in a different manner.....

From FX Street.com site.....
Goichi Hosoda developed Ichimoku Kinko Hyo in the early Showa era (1926-1989) and copyright is owned by Kabushiki Kaisha Hendou Souken. However, Hosoda, a Japanese newspaper writer, only published his findings in 1969 and from that point forward Ichimoku Kinko Hyo has become a permanent feature in Japanese trading rooms.
.....end quote..

This is the formulae to calculate the charts....

The five lines are calculated as follows:

1) Tenkan-Sen = Conversion Line = (Highest High + Lowest Low) / 2, for the past 9 periods

2) Kijun-Sen = Base Line = (Highest High + Lowest Low) / 2, for the past 26 periods

3) Chikou Span = Lagging Span = Today's closing price plotted 26 periods behind

4) Senkou Span A = Leading Span A = (Tenkan-Sen + Kijun-Sen) / 2, plotted 26 periods ahead

5) Senkou Span B = Leading Span B = (Highest High + Lowest Low) / 2, for the past 52 periods, plotted 26 periods ahead

As far as I am aware no alternative formulaes to plot the 5 lines exist.....

The only variation could be the periods used.....

If you have seen any alternatives then please post it here......

The names vary because the translators used differing terms when translation....but it's the same....
 
Hi Zambuck,

It's OK, I understood what you were saying last night and I was possibly being a little too glib in my earlier reply :cool:

What you're saying is this:

Senkou Span A = Leading Span A = (Tenkan-Sen + Kijun-Sen) / 2, plotted 26 periods ahead.

Or at least it should be so far as I know? And, to be clear, I'm not saying that I do know anything very much about these charts! :(

In other words, in "our" terminology we should be drawing our first preceeding span as follows:

Span 1 = (Standard Line + Turning Line) / 2, plotted 26 periods ahead.

And we're not or so it seems to me - that's my understanding anyway? :)

Cheers

mayfly
 
Just looked at Muranaka's article again and I see Span 1 and Span 2 do equal each other for a longish period of time on the right of the gold chart. The mystery deepens. I doubt however that these charts are copyright as Zambuck suggests. What is clear is that there is no authority at the moment unless one emerges. I am always slightly suspicious of web site definitions. Zambuck said tenkan and Kijun are moving averages. I am not sure how true that is. Anyway I am not an expert and will watch developments.

Zambuck do you think the Spans should be carried forward like updata or not like metastcock? Is there some definitive answer on that. I can't see one, other than the chart is the S&C article.

Pass the sherry :)
 
GruntnoWay said:
What is clear is that there is no authority at the moment
Agreed.

GruntnoWay said:
I am always slightly suspicious of web site definitions.
Agreed.

GruntnoWay said:
Pass the sherry
Now you're quoting from one of my former university Supervisors ... he also had the habit of offering "Sweet or Dry?" The "dry" was always Harvey's Bristol Cream and funnily enough nobody ever fancied trying the "sweet". :)
 
Roberto said:
Agreed.

Agreed.

Now you're quoting from one of my former university Supervisors ... he also had the habit of offering "Sweet or Dry?" The "dry" was always Harvey's Bristol Cream and funnily enough nobody ever fancied trying the "sweet". :)
...Please educate us would you...?..If you know more....

After all your answers are also...on web site...

So should one question your agreement..?...
 
GruntnoWay said:
Just looked at Muranaka's article again and I see Span 1 and Span 2 do equal each other for a longish period of time on the right of the gold chart. The mystery deepens. I doubt however that these charts are copyright as Zambuck suggests. What is clear is that there is no authority at the moment unless one emerges. I am always slightly suspicious of web site definitions. Zambuck said tenkan and Kijun are moving averages. I am not sure how true that is. Anyway I am not an expert and will watch developments.

Zambuck do you think the Spans should be carried forward like updata or not like metastcock? Is there some definitive answer on that. I can't see one, other than the chart is the S&C article.

Pass the sherry :)
.....Single malt for me actually....as am in middle of wife's birthday, but just ventured into the computer room....

OK...Lets forget the web site definitions for now....

Is Updata using the same formulae, OR have you no access to these to know for sure..?

Are the definitions of construction of charts, indicated by me are as, as you understand it, or are they different than what you have found.....anywhere..?

If so what formulae is Updata using...?...So far no one has mentioned that at all....!
 
Last edited:
Mayfly said:
Hi Zambuck,

In other words, in "our" terminology we should be drawing our first preceeding span as follows:

Span 1 = (Standard Line + Turning Line) / 2, plotted 26 periods ahead.


mayfly
...Yes that is correct as i understand it....

But Updats's Span 1 line does not compute according to the formulae.....

and that is the crux of the matter...

Updata users are saying that there are 'different' ways to draw this chart...I agree to that also...

But so far no one has actually posted the formulae that Updata uses....

I am not questioning Updata's chart...I am only asking what formulae does Updata use to determine Span 1 line...

Fair question, would you not say?
 
zambuck said:
I am only asking what formulae does Updata use to determine Span 1 line...

Fair question, would you not say?

It's a fair question. I have no idea. I suppose we won't find out until the new year.
 
...Until then...all the best...

Marry Christmas and Happy New Year to you all.....if we don't talk before that...!!
 
I have played with the Updata setup.
There is the opportunity to change the variable for the turning line but it seems to copy through to all the others. Zambuck seems to be correct in that the lagging span appears to be a carbon copy of the price line, displaced backwards....this is handy if you are using candles since you do have a reference to look at.
The Standard line seems to be a carbon copy of the upper span however I fiddle the parameters.

As to which is correct. Tricky.....I've just been watching "Life of Brian" & so couldn't possibly comment this afternoon ;0)
I still see these as fundamentally a new way of looking at and using Moving Averages. So conceptually, I may either be too hidebound or too statistical in my approach.
Since maths is maths, we can only be debating interpretation in the end.
Regards


N.
 
re: Updata formula.

I have found the TechSupport to be very good.
Send an email asking which formula they used.

NB: I sent a few emails this year asking for changes etc, and I am particularly happy, since the new release has Donchian Channels, etc, something I asked for ( I suspect a few others as well )
(my point is they are receptive and are responsive to requests - so ask them )
 
zambuck said:
...Please educate us would you...?..If you know more....
I can assure you confidently that I know less about this subject than you do.

zambuck said:
...After all your answers are also...on web site... So should one question your agreement..?...
Probably. Good point. :)

It seems to me from trying to research this a little online (the only reasonably convenient way I have of doing so, if nothing else) that nobody really seems to know very much about it with any real confidence or certainty, apart from people with something to sell, perhaps. The thing that strikes me as a little odd is that whereas there seems to be some consensus that the original time-scales used in the construction of these charts were based on the cycles observed and measured from a 6-day trading week (in Tokyo), almost nobody seems to have any interest in discussing whether and how to make the necessary adjustments now that the trading-week comprises only 5 days.

My interest in this subject relates mostly to the "clouds", or area between the two right-shifted moving averages. I've noticed from a limited analysis of day charts that cutting the time-scale of both of these moving averages down by 1/6th, plotting them accordingly and then avoiding trading (with one of my basic trading strategies not reliant on other indicators) when prices are between the lines does indeed seem to confer an overall benefit, so what I'm planning to do, when I have time, is to repeat the process with some number of other similar constructions of randomly selected periodicity, to see if any of them also confers the same apparent benefit, which I suspect it might, for reasons only cloudily understood and in any case mercifully outside the scope of this post, and indeed this sentence, which has already gone on for long enough, not to say for too long. :)
 
My answers in blue italics....


Roberto said:
I can assure you confidently that I know less about this subject than you do.

Probably. Good point. :)

It seems to me from trying to research this a little online (the only reasonably convenient way I have of doing so, if nothing else) that nobody really seems to know very much about it with any real confidence or certainty, apart from people with something to sell, perhaps. The thing that strikes me as a little odd is that whereas there seems to be some consensus that the original time-scales used in the construction of these charts were based on the cycles observed and measured from a 6-day trading week (in Tokyo), almost nobody seems to have any interest in discussing whether and how to make the necessary adjustments now that the trading-week comprises only 5 days.

....yes good point and that has been mentioned somewhere on this thread.....but before we even discuss that there must be some for of agreement as to which formulae is correct one.... is the one supplied by Updata or Metastock the correct versions....or are they both correct..??

Construction of any charting indicator is a precise science...like P & F charting is very precise etc etc...One cannot take 'liberty' to suit themselves....Well they can. but then the results may be wonky...


My interest in this subject relates mostly to the "clouds", or area between the two right-shifted moving averages. I've noticed from a limited analysis of day charts that cutting the time-scale of both of these moving averages down by 1/6th, plotting them accordingly and then avoiding trading (with one of my basic trading strategies not reliant on other indicators) when prices are between the lines does indeed seem to confer an overall benefit, so what I'm planning to do, when I have time, is to repeat the process with some number of other similar constructions of randomly selected periodicity, to see if any of them also confers the same apparent benefit, which I suspect it might, for reasons only cloudily understood and in any case mercifully outside the scope of this post, and indeed this sentence, which has already gone on for long enough, not to say for too long.

How did you cut down the moving average..??....Did you use the same formulae to construct the standard line..?...or did you use one of your own...Would you mind posting that formulae here.?..or your results to see how they would vary from the standard BUT using different time scale...

I am trying to create an exploration now using these indicators and intend to do test WHEN I make some sense of these indicator...


:)
 
GruntnoWay said:
Am I mistaken or is one of the Spans exactly the same as the standard line in the chart in this posting.

http://www.trade2win.com/boards/showthread.php?t=8570

from some trading platform

Now i am really confused.
It would appear that Span A line is different than standard/turning lines....

See Span A lines before 6.20 where it is more obvious, I think...

I think that if the Standard line and turning lines are almost the same value then the readings will be same and therefore when added together and then divided by 2, it would plot exactly the same 26 days ahead.....that is the formulae is same as the one used in MS....
 
Hi Zambuck,

I think we’ve now got resolution on some of the issues that you raised surrounding the presentation of these charts on this thread.

To be brief, Updata have added a third parameter to the Ichimoku dialog so that it can be specified as 9,26,52 – or whatever settings the user chooses – which will give users far more flexibility in the way in which the charts can be presented, and it seems that they’ve also modified the span 1 calculation to match the one shown in the article in Stocks and Commodities; which you can see here http://www.forex-books.com/articles/techan/ichimoku.pdf

I’ve redrawn the S&P chart using the default settings of 9,26,52 and so with luck my chart should look similar to one of yours drawn with the same settings. :eek:

Please let me know what you think? :)

HTH

Best regards

Mayfly
 

Attachments

  • S&P 500 INDEX_Ichimoko.png
    S&P 500 INDEX_Ichimoko.png
    30.7 KB · Views: 369
Top