my tradestation code

james1234

Member
Messages
69
Likes
4
ive been reading alot on here that indicators have no proven edge and ta is nonsense. Im a realist and i tend to agree with the above. I would say though that cycle analysis in multi timeframe can be used to find exhaustion points and i feel the results below prove there is infact a small edge.

Pedro pete helped me program the following code about 18 months ago, since then ive had alot of stuff added to it which has improved performance.

No one seems to make money trading, not consistantly anyway, but i feel this is because you have to view it from another angle and not expect to win everyday and also ive found to smooth equity curve there is needs to be a few systems running or you make money from your job/business to counter act bad weeks, imo.

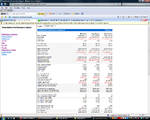
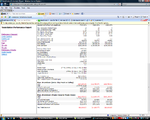
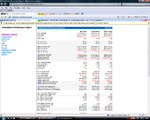
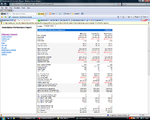
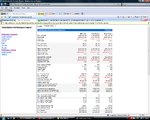
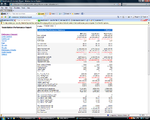
I have many many parameters, and below is not cherry picked and is far from the best performance report, i just posted a realistic tradeable report to get your opinions, this way im being true to myself and getting some real feedback.

I have gone through the code and tested for errors at every step possible in live real time, there is no bugs at present. I have added some realistic slippage to all trades, I have added comms. Execution is of course another matter and one i will feel with in real time.

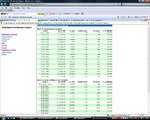
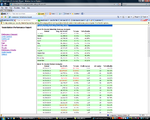
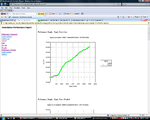
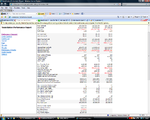
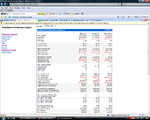
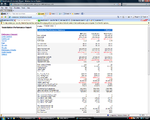
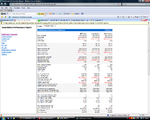
This setting as you can see goes back to 1993 and is profitable every year, so i have used one setting only to test this period, so therefore i have not optimised to suit so to speak, one setting for all trending and oscillation periods going back to 1993.

Results are not nothing great, but i feel also they cannot be random, to me there is a proven edge there, even if its only very tiny. Also the results do not take into account a better money management style and there is no compounding within the results you see there.

Anyway i have posted to get your opinions and also to debate that there is an adge to be found in using cycle analysis.

Results are based just on market, so anything that follows $indu works as ive tested this with similar, sometimes better performance.

this is far from my sole opinion, at the moment im very much into scalping using x trader after recently laerning somethings from a orderbook scalper, but i post for debate and also to argue cycle analysis can provide an edge, but its how we use the analysis that counts, for example trend following or meran reverting.
 

Attachments

  • performance summary.png
    performance summary.png
    162.4 KB · Views: 1,101
  • performance summary2.png
    performance summary2.png
    159.4 KB · Views: 1,348
  • annual.png
    annual.png
    158.1 KB · Views: 477
  • monthly.png
    monthly.png
    155.6 KB · Views: 512
  • graph.png
    graph.png
    213.6 KB · Views: 1,286
has this been optimised? have you done any walk forward/out of sample testing? why cash data, does it perform the same on ym?
 
yes i have spent about 2 years finding the best settings, but the difference is i have tested the whole period with just this one setting therefore i have not optimised to suit, just one setting on whole period and the complete trading day start to finish. I have done some testing with this setting during trending periods and also during oscilation periods in time, the conclusion was settings work slightly better during oscilation periods but the good news is they also are profitable during trending periods because of the nature of my stop and targets, therefore i feel its a unique setting as it works in both conditions.

I have used cash data in this report and i know $indu is not tradeable but i wanted to see how it preformed on market, i will later post a report from ym and also from dia, es, tf etc to show it works the same which makes sense as these all closely follow the $indu.

The targets/stops are volatile based and like i say the settings are fixed and nothing has been altered to fit during the testing period, therefore results are fair and true as they can be.

Results are not great i know but every backtest report i see on the internet does not test one setting over so long a period with same performance, also most results i see do not include any slippage or comms.

I could enter using limits too which could help with comms.

The code uses a top down approach as i was taught by grey1, but i have evolved it myself meaning some of my own ideas have been added since.
 
anyone care to comment?, is this system tradeable?, random?, nothing special?, unrealistic?

it is very easy to fool ourselves in the system development process. there are so many biases and potential errors at every stage of the process......its impossible to make any worthwhile judgement with the info u have provided. personally i would only trade a systme that involbves scientific methods from start to finish, passed all walk forward and live testing. even then there are no guarantees.
 
hi, the results for 2010 are very profitable, you need to add the top result to the second anual result to get the full 12 months.

thanks for the feedback, i myself am biased but i find it hard to beleive i have not proven an edge considering it is profitable every year to 1993 with realitic position sizing, the profits and curve smooths with an increase in postion size. Also no averaging down nor compounding has been used in results meaning there is room for further improvement.
 
hi, the results for 2010 are very profitable, you need to add the top result to the second anual result to get the full 12 months.

p3 of 5 of the report shows 144 trades for 2010, pf 1.04, just beats b/e, no??
 
thanks for the feedback, i myself am biased but i find it hard to beleive i have not proven an edge

dont take this the wrong way but you havent proven anything other than your able to produce a nice looking equity curve with tradestation. the only way one can have confidence that you havent curvefitted is to follow the development process as mention in previous posts. the best thing u can do now is to live test, small size or paper trade for the next 100 trades or 6 months. if the result are consistent with the backtest then you may be on to something. even then it can be misleading, eg if you live tested at the start of 2010, you would have found several losings months and it would have been a reasonalbe conclusion that the system was performing below expectations and curvefitted.....that is why having several out of sample periods provides useful info.

ps everyone has biases. :LOL:
 
hi, if i wanted to impress i would have posted my milliondollar code report but thats unrealistic postion size and beyond my account size to trade. Its not what im about, infact this is one of the worst performing reports i have but it is true and performs the same going forward as i have spent alot of time doing just that.

please look at last 12 months at top of annual to get a full year, the one under is not based on full year and only 100 or so trades.

also i have reports taken at time of worst drawdown, trend, oscilation periods in time all again profitable and you should be able to make that out from the max drawdown figure.

also it is very robust as it works on stocks, forex etc

thanks for your feedback.
 
as for the sharpe ratio you must bear in mind the sample range of trades, i could post the best year with high sharpe but i didnt want to mis guide anyone.

I was told the best way to backtest is to use only one parameter or setting over the whole period this way you have not curve fitted to suit each era in time.
 
so there is only 1 parameter and this has not been optimised at all??

out of interest, how many lines of el code have u used?
 
yes this is my whole point, yes just one setting, not been messed with. Take alook at some of these reports...................................some out of sample testing and some different parameters i have but again not curve fitted to suit as i would not waste my time if you know what i mean, completely pointless imo as anyone can post a curve fitted performance report and most system seller do just that.

the code is huge, many many modules been added to it and taken 2 years to develop along with throwing alot out. I know this means nothing at the end of the day.
 
take a look........although i prefer the first report as it wins every year since 1993 which holds more substance to me.
 

Attachments

  • milliondollar.png
    milliondollar.png
    156 KB · Views: 252
  • es1contractonly.png
    es1contractonly.png
    155.5 KB · Views: 275
  • eft,financials.png
    eft,financials.png
    157.5 KB · Views: 276
  • 10 years.png
    10 years.png
    158.2 KB · Views: 271
  • esscalper.png
    esscalper.png
    155.9 KB · Views: 304
a few more only front pages which i know is hard for you to analysis, they were done some time ago
 

Attachments

  • vwap.png
    vwap.png
    152.7 KB · Views: 257
  • ymdailytrader.png
    ymdailytrader.png
    155.8 KB · Views: 211
  • scalping.png
    scalping.png
    155 KB · Views: 224
all scalping reports were down using tick data for 6 months as this is as far as you can go back with tick data, other than that it is each 1 min interval.

I know we all wish for a profit factor of like 3.8 or something but to me its not realistic over a large sample of trades and this is why you see all the approved system sellers on tradestaion can never produce this kind of result over the long haul hence why i posted a large date range so you can see im not hiding anything, again of course this is provided the code is bug/glitch free and performs as it does in backtest as it does going forward, which i thing it is as close as you can get considering the stages i went through with it.

backtest is not ideal i know but ive only used it to see if my system works back in time which gives me more confidence and an idea of how it trades going forward so im under no illusion to the idea of backtesting and it is not fail proof.

I have never met a trader yet who wins everyday or even every week, lescor over at elite is the best im aware of and he even loses many weeks at a time but his equity curve and performance is similar.

My idea was forget trying to win everyday or every single week, this is too much pressure and un realistic unless your gambling. My thinking was put enough money in for the worst case drawdown and more, and allow system to run and run leaving it alone until the end of each year, i can easily counter act the worst losing weeks by the wages i get from my self employment business i have, i think this is a good way to look at it for i have never been able to make money consistently trading manually as emotion and other things just get in the way.

Again i appreciate your thoughts
 
I don't get it.
what exactly are you looking for?
do you trust your system works? than trade it. risk whatever you can and just let it run.

i'm not sure what kind of response you;re looking for, given your 2 years of developing this system, i trust you know everything there is to know about systems trading and dev. so - good luck and godspeed!

as was mentioned before. without examining the code/development process thoroughly - one cannot assess whether you made mistakes and if there;s something wrong with your results
 
no, there is nothing wrong with results, nor the system development, i just wanted opinions wether anyone would consider trading this system?, which no one has conclusively said yes or no.

Although there seems no doubt there is an edge, the system is not perfect and has many losing weeks at a time so is not ideal, but this can be smoothed by basket trading.

Many people look to win everyday and would have trouble with a system that can lose 2,3 weeks at a time, just wanted some thoughts from some experienced traders that was all.

Maybe im too looking for perfect when perfect does not exsist, maybe i should just trade it.

So to be clear if we talk only of the results i posted and do not take into account my system dev and consider that is all done correctly, would you guys trade this?, sorry if i was not clear.

Please remember this is only one instrument and results are very much smoothed with basket trading.

Someone mentioned here already they would not trade it because of low sharpe ratio and this was the kind of feedback i was looking for.
 
Top