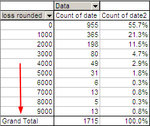
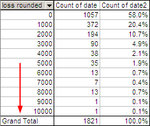
my journal 3

Does it make sense to relativize drawdown?

Today I need to focus on a problem that is easier to solve than I had thought. Since I always keep talking and using the "relativized" version of the trades profits/losses, and therefore relativized drawdown, I need to find out if this makes sense.

First of all, what is the rationale for it and does it make sense?

Rationale for it
The investors argued and convinced me that if CL today is at a value of 100 dollars, but was at 50 dollars a few years ago, a 5 dollar loss when it was at 50 needs to be relativized to be a 10% loss today, which is not 5 dollars but 10 dollars. Otherwise you'd feel safe just because the recent losses were small, and fooled into thinking that a 10% loss can never happen. So by "relativizing drawdown/losses" we mean adjusting, to today's price levels, losses/drawdown that took place at different underlying price levels. I described the process at the end of this post. I used this equation: loss of yesterday is to price of yesterday ("value" of yesterday) what relativized loss (x) is to price of today, therefore relativized loss is equal to loss of yesterday multiplied by the ratio of price of today to price of yesterday:

127204d1325912835-my-journal-3-relativization.jpg


Doubts
This now seems to make sense to me, and, after resisting the idea (because of the amount of work involved) for a while, I accepted and implemented it. But I have always had one doubt: is CL (and the other futures) really likely to fall/rise when it's at 50 as it is likely to rise/fall when it's at 100? I keep wondering if maybe when price is at 50, being so low, it is not as likely to fall, but more likely to rise, and viceversa. Or I wonder if volatility doesn't decrease when price is high. And this doubt is not good. I plan to keep my analyses low, because i've done enough of them, and to clarify all doubts, within the work i've already done.

Another important implication of this is that we are not just risking the overestimation of losses/drawdown. If today's prices are lower than yesterday, the ensuing drawdown will be proportionally decreased. So it really has to be right, because otherwise, we could be causing damage to our drawdown estimates.

Rock Loves Chopin - Nokturn Es-Dur Op. 9 Nr 2 - YouTube

Solution
Well, I just woke up and as usual I had the solution for a problem. I found out that it can be easily verified. This is what I'll do. I already have the daily prices of all these futures for all the years of backtesting. Now I just need to find out 1) if the average % range varies as price varies and 2) if the maximum rise/fall varies as % range varies. If everything roughly matches, then I'm ok, otherwise there's a risk of overestimating/underestimating drawdown.

[...]

Here's some results. I've run the test on AUD, and here it is:
aud.jpg

Ok, I was fearing that we might move less at a high price, whereas here it would seem the opposite, that the % change is higher with a higher price. Let's talk about volatility, which is a clearer concept. Volatility seems to be slightly higher at a high price than at a low one. This could be a total coincidence, also because whereas the green-highlighted line seems to agree with this hypothesis, the yellow ones disprove it. Unfortunately we do not have a case to show the opposite situation: great volatility with low prices.

I will verify it on the other futures. Otherwise this would mean that relativizing is not even enough anymore, because a 2% move of CL at 50 would be matched by a 4% move by CL at 100. This would mean that if we move 1 at 50, we don't just move 2 at 100, but 4. So if it were a tendency, then relativization is not only necessary, but it underestimates the real impact of drawdown. What if we were at 50 today and were to relativize the drawdown we saw at 100? In that case, we'd be overestimating it, IF and only IF, prices do move more in % when they're high than when they're low. But it's too early to draw such conclusion.

Let's now go and check CL:
cl.jpg

Once again, some disproving, a lot more than for AUD, but also the confirmation that the really big moves happen at high values (high prices of the underlying asset). Yellow highlighting shows that there were big moves in years when price was low. Green shows that there were small moves in years when price was high, but magenta shows that the highest % moves happened when prices were high, and viceversa.

So this would confirm not only that relativization is good, but that it's not even enough to fully compensate for what happens at higher prices. Instead, in those rare cases when today prices are lower than yesterday, it actually underestimates the drawdown... no, wait: that concern is gone, because if, that's the case, a lower price is accompanied by a relative lower volatility, and therefore it's ok. The problem is only when we're relativizing the other way.

Now I'll check YM, because it could still be a coincidence. If it isn't it could mean that people panic (with a consequence on prices) when prices are at their highest. Of course it could mean a lot of other things. It's all a guesstimate here.

Here's YM:
ym.jpg

This is good. Finally something showing the lowest (relative) volatility at the highest prices (magenta highlighting), the opposite of what I've seen so far. And also high volatility at low prices (yellow highlighting). The only problem remaining is that the highest volatility is shown at the highest prices. And this has been the case so far. Everything else varies and might be due to chance.

Now I'll check ZN:
zn.jpg

Once again, high prices have average volatility (cyan highlighting) and everything can be compared to the low prices, except the usual thing: the highest volatility is found at the highest prices (yellow highlighting). This variety of outcomes doesn't bother my method of relativizing, but it makes me wonder about the nature of this. It's as if, for every future, at the highest prices, there were some sort of acceleration, at the top of that mountain of prices. I think I know when it happens: it's when people get euphoric because prices are high, and then people panic because they think it's falling... there are really big swings at the peak of that mountain. However, I remember this happens at the trough, and there it's easier to lose big % (we're always talking about relative volatility, relative to price). So I don't understand why this doesn't show in my statistic. I would think that when we're at the peak of 100, getting to 110 is just as easy as it is getting to 55 from 50 (same for the falls). But this doesn't show. Maybe the falls are not as steep when we're at the bottom?

Let's check the GC and then I'll stop.

gc.jpg

Yellow highlighting shows that once again tops and bottoms are comparable. But the magenta highlighting shows that, once again, the highest volatility takes place near the highest values of any given period.

However this does not invalidate my relativization method, because, as a rule, we can say that the daily % changes are similar throughout the sample, regardless of where price is. Yes, the highest volatility always happens at the top, but this doesn't invalidate my relativization, because the difference is not so noticeable. When I'll be at the top, I'll be slightly underestimating the losses that took place at the bottom (if they happen at the top, they're likely to be bigger) and at the bottom I'll be slightly overestimating the losses that took place at the top (despite the fact that I am decreasing their value, with the equation shown above).

Summary
Relativization is not just useful but it is necessary, in order to assess drawdown and losses correctly. Indeed, since prices more or less move the same (same relative volatility) at the top as they do at the bottom, if we're at the top we need to increase the value of the losses experienced at the bottom, and if we're at the bottom, we need to decrease the value of the losses experienced at the top.


Chopin Nocturne Op. 62 #2 - Rock version - YouTube
 
Last edited:
resampling previous portfolio

After writing this post, I kept thinking about the concept of "resampling", and I want to take it yet one step further.

If resampling makes sense, and I think it does, and if it can help discover an overoptimized portfolio (where coincidentally the wins by one system compensate for the losses by another), then the process should be able to detect the huge mistakes in our previous portfolio (investors' and mine), which was intentionally optimized, because we thought that was the way to find the optimal portfolio (we even used a genetic optimizer, Palisade's RiskOptimizer).

Given that the risk of blowing out (by starting trading at any given date) doubled for my present non-optimized portfolio on both my forward-tested and back-tested sample, I would expect that hyper-optimized portfolio to at least triple (relative to the regular chronological order of trades) after a resampling of the back-tested data. My present non-optimized portfolio went from 5% to 10% (chance of blowing out) for forward-testing and from 11.5% to 23% for back-testing. Which tells me that one way or another I did optimize it, even though not scientifically and not consciously.

Let's see what happens to this one, and if, in fact, resampling can help detect an overoptimized portfolio.

Ok, first of all, step #1, the non-relativized performance we assessed was on a daily basis, and here it is:
Code:
[B][COLOR=red]max dd $        max dd days    total profit $    sharpe[/COLOR][/B]
-17,879                    28    1,650,783    4.92

Step #2: while we were already trading the 160k portfolio, in August, I was asked to calculate the relativized drawdown, and the relativized performance, always day by day, and I came up with this information:
Code:
[B][COLOR=red]max dd $        max dd days    total profit $    sharpe[/COLOR][/B]
-26,574                    45    2,220,009    4.42
11k increase in max dd in dollars, 17 days increase in days, increase in absolute profit, and decrease in sharpe ratio.

This relativization already brings us closer to reality, with a 50% increase in max drawdown (both depth and duration) and yes an increased profit, but not enough to compensate for the increased drawdown, so the sharpe ratio gets worse, even though by not much. But even if it stayed the same, this tells us that we need a bigger capital.

Now, after relativizing drawdown, let's see step #3: what happens if we go from a daily timeframe to a trade-by-trade timeframe? This should bring performance a bit down (the higher the timeframe, the more losses tend to be hidden by the profit of profitable systems, and viceversa), and it should bring us yet another step closer to reality.

Code:
[B][COLOR=red]max dd $        max dd days    total profit $    sharpe[/COLOR][/B]
-30,253                    N/A    2,220,009    N/A

Since, as expected the difference is small, I will now focus on the statistical data that I was gathering yesterday, telling us the probability of blowing out by starting at any given day with x capital (I'll analyze that differently, because, unlike my capital, the investors had a much bigger capital).

So here is step #3 again (relativized drawdown on a trade by trade basis) but with different information:
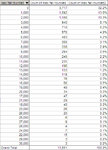
160k.jpg

The investors were willing to risk all the profit made to date (37k) plus some more. According to this table above, the risk of blowing out, with that available buffer capital, "profit cushion", "uncle point", whatever you want to call it, is zero %. So that portfolio, which failed (or simply got unlucky: you don't have to be wrong to blow out an account) seemed on paper much much safer than what I am trading right now (relatively to the capital available). With the portfolio I am trading right now, according to backtesting, I have an 11.5% chance of blowing out. That one says zero. Go figure. I mean I already knew this, but I hadn't fully realized it. After taking that beating I went and traded what appears to be an even riskier portfolio. Even though I have a feeling that the systems are better and I am certain that my portfolio is less optimized, in that I chose the best systems, and not (via genetic and brute-force optimization) those that fitted together the best. But the statistics aren't showing yet. At all.

[...]

IMPORTANT:
Wait a minute: if the systems in the long run are correlated and by overoptimizing the portfolio I chose a combination that limits but doesn't entirely eliminate this correlation, by resampling I might even get a better result, because if there's anything my resampling does is guaranteeing there's no correlation between any of the systems. So I guess resampling is only good at detecting if I put together a bunch of systems that compensate each other, but it might yield even better results than reality when I could not manage to fit together the systems. The reality is that my optimization is better than reality, but also resampling is better than reality, because in reality systems are correlated. Let's just say that resampling is there to tell us that the systems are at least as bad as resampling, in case we got better results from the datasample available.

Let's move to step #4, and see what resampling (randomizing the trades) does to that "160k" portfolio. If it will give us worse results, it will mean that the portfolio is less curve-fitted than random trades, thereby representing and suffering from the correlation of trades, but still more curve-fitted than what the future is like, and underestimating the correlation of trades and systems. (Or, once again, we might have gotten very unlucky).

Given that for my present portfolio the results of resampling were these:
1) back-testing: % of blowing out from 11.5 to 23%, max drawdown from 10k to 20k.
2) forward-testing: % of blowing out from 6% to 12%, max drawdown from 5k to 10k.

And, given that this 160k portfolio was extensively overoptimized, I would expect the 30k drawdown to more than double, at least to triple. And I would expect the % of blowing out to go from zero % to 20%. Plus of course, as mentioned and explained several times there are many reasons (soccer championship example) why the future is worse than the past (according to my estimates, from previous trading, the future is half as good), and this might explain why we stopped trading exactly at the lowest point of the drawdown, which was 48k, at the end of September (it kept going up ever since).

Here it is, step #4:
160k_resampled.jpg

The max drawdown did not triple but increased only by 30%. And the % probability of blowing out is still zero, given that we waited until 48k (pretty amazing that we stopped trading exactly on the day of the max drawdown), and that according to the resampling summary table, there are no situations where that drawdown would ever be reached, even had the trades be random.

Now the problem is two things: by optimizing the portfolio I managed to make the trades slightly better than random (just 30%), but we know that all futures are correlated, and that creating, on those correlated futures, systems that are not correlated is practically impossible. So, even this resampling, as i said before, only tells us: "hey, you can't expect your systems to do better than me" (i.e. "random trades"). But what I am saying is that even this extra step ("step #4", after #2, relativizing losses, and #3, switching the timeframe) of resampling would not have warned us as to the risks of the portfolio.

The only thing missing is that there's an underperformance relative to the past.

So it's not only every portfolio that does better than random sampling of its back-tested trades is overoptimized (by choosing the systems that fit well together).

We also have to expect an underperformance due to:
1) the systems losing their edge because others start using them
2) the markets changing
3) the survivorship bias or a similar concept (i don't know what it's called), the championship bias. Some systems may be successful just because they got lucky and you found them by trying and trying (despite the out-of-sample methodology, some lucky ones could get through). Other systems may have won the soccer championship but that doesn't mean they'll keep winning: just because you pick the previous winner, it's not automatically the next winner. Things keep changing (I guess this is close to point #2).

For one reason or for another, that I can't explain nor understand fully, my estimate is that my systems, even without optimizing the portfolio perform 50% worse. You expect 50k of profit, and you only get 25k. You expect a drawdown of 37k and you get more, maybe 50k.

Basically, we did overoptimize the portfolio, and we did get very unlucky, but even after taking that into account, to explain the bigger drawdown, we have to recur to this concept of underperformance.

So, what happened to the famous 160k portfolio that we started trading on the 16 of August and stopped trading on the 26 of September? Here it is (this below is the forward-tested sample, which covers a different period from the back-tested sample, on which i based the study and tables until here):
160k_its_story.jpg

And, in light of this, what are my chances of not blowing out?

It depends how we interpret that 50% underperformance. Given that a portfolio cannot expect to have better trades than its trades randomized, we have already brought the relativized max drawdown from 10k to 20k, and the probability of blowing out (with a capital of 4k) from 11.5% to 23%.

Now we should add to that, the certainty of 50% (my estimate) underperformance. This will bring me to about 33% chance of blowing out and 66% of surviving. Also, I am counting on the fact that this time I did not choose the systems based on how well they fit together but on how good they are: I practically chose all the best systems and found out that they fit well together (I probably got rid of one or two that did not fit well, but nothing compared to the previous portfolio, where I used the palisade's RiskOptimizer software).

So, I am risking 2k, and I am going ahead with the experiment, knowing that I have on my side about 66% of probability.

Chopin Nocturne Op. 62 #2 - Rock version - YouTube

I said before, but it's important so I am just going to repeat this to myself to clarify it. Writing just as I think out loud.

A portfolio's trades cannot be uncorrelated, no matter how many futures you're trading, it's not going to be like rolling dice or flipping coins. So, if resampling the trades turns out to be worse than your back-tested results it means that your sample was lucky or that you made it lucky by choosing only specific systems. Then what counts as correct is the performance on the resampled sample.

If instead the systems turn out to do worse in the back-tested sample than in the resampled one, it means you didn't overoptimize anything, and you should trust the worse result, which the ones on your sample.

On top of all this crap (relativization of profits/losses, measuring trade by trade, resampling), you have to add an underperformance of your systems by about 50%. Only then will you have fair assessment of your future risk with that portfolio and capital.
 
Last edited:
Damn, a discretionary trade:
Snap1.jpg

One of mine. First one in a year. I couldn't hold it. Today the systems are not trading (US holiday), but some markets are half open, I hadn't slept, I looked at it, and the NG was losing 4% on an early Monday morning, with gap down.

It looked like it was coming back up (going up and down, forming a horizontal support line), so I just went long on it.

This is what happens when I can't sleep and I skip work. Once by staying home for 3 weeks, I more than tripled my account, from 8k to 26k (then one month later I blew out the account). But it's definitely something unhealthy that I want to avoid.

It was stronger than me. It happened. I saw the opportunity, actually I was looking for it. I found it, and it happened: I placed a discretionary trade.

That's why I'll stop doing math for a while, a week or more, stop staying so much at the computer and try to sleep. That's the number one problem I have right now, of those that I can solve.

Now I am up, waiting for price to take off (the famous "it can't fall any lower" trades).

[...]

Forget about it. I closed it (profit of one tick). Let's pretend it never happened.
 
Last edited:
gambler's fallacy keeps bothering me with regard to drawdown

Gambler's fallacy - Wikipedia, the free encyclopedia

Snap4.jpg

Today wikipedia doesn't work, so I had to take a snapshot very quickly, because after a few milliseconds it redirects to their petition.

Both with coins and with drawdown, gambler's fallacy keeps polluting my reasoning.

A few days ago, in a long post, I've established that, as far as my trades are concerned, the probability governing losses and drawdown corresponds to "sampling with replacement":
Sampling With Replacement and Sampling Without Replacement

In other words, if your chances of winning (always as far as my trading systems - not with all trading systems, cfr. long post) are 2 out of 3, and you incur a long series of losses, the next trade is still as likely to be a win or a loss. This is very important because it affects the gambler's fallacy problem i was mentioning.

Since this "sampling with replacement" also applies to coins, which are simpler, and yet are the same as my trades in this aspect, I will talk about coins.

It is clear to me that after you toss a coin, if you get a head, the next toss has still a 50% probability of resulting in tails: the probability of tossing tails doesn't get increased by being preceded by a head. This is what probability theory says, and it is also what statistics of coin tosses say. And it makes sense to me.

So if it is true after one head, once again probability theory and statistical results say that it stays true after ten consecutive heads.

But this is where it gets complicated to grasp, or rather where I tend to forget it, and it tends to be counter-intuitive, with regard to coins and even more to drawdown. Because, even though you know this, you also know that the probability of getting 2 heads in a row is, from the start, only 25%. And to get 3 heads in a row, it is 12.5%, and for 4 heads in a row the probability (from the start) is half, which is 6.25%.

So what becomes counter-intuitive and bothers my thoughts is this: knowing that there is such a small chance of drawdown (in coin tosses and in trades) exceeding that streak of heads/losses, you feel like saying to yourself "why shouldn't I jump in at the tenth consecutive loss/head?".

While you know that after ten heads, the chance is still 50% (similar situation for trading), you also know that the chance of that happening, from the start, is one in 1024.

So I keep on saying to myself "but hey, it won't help you" and then again "but how likely is it to happen?", and then again "but hey, it won't help you"...

This is particularly annoying with trading, because I happened to, randomly, resume my trading after a week of drawdown. And then I survived without much damage another week of drawdown, and this we're in, is the third week of drawdown. I looked at my previous stats, and this is very rare, and usually there's no more than 2 weeks in a row. So I feel lucky to be at this point with my capital still intact, but this - i realize immediately - corresponds to gambler's fallacy, because, as established, my trades are not related to one another, and wins and losses do not take place in an alternated sequence.

So, once again, I've clarified previously and here again, that it makes no difference whether we start trading a system (or portfolio of systems) after a series of losses or wins, and that it makes no difference whether we bet on tails after a series of heads, but, after saying this, so many times, I look at my trading systems and I feel reassured by the fact that there's some drawdown behind me.

I can't help it, and I don't understand how I can at once understand the theory, prove it to myself empirically, and yet still not believe it.

Maybe this has something to do with the fact that i've proven it with coins, by using excel, but I haven't been able to prove it, despite resampling, with my systems. I haven't been able to produce a streak of 100 years of losses but just 3 months, so I am given the false impression that the most losses can last is 3 months, whereas, if the sample was large enough, there would be instances when they last 100 years.

So, all I can do for now, is write a post here, every once in a while, to remind myself.

With coins, I've got this workbook to clarify it to me:
View attachment assessing_probability-theory_vs_practice.zip

I've never found anything so simple and yet so hard to understand. It's so simple that it's a pleasure to think about it. It's so hard that you forget it once a day.

Ok, I just explained the whole thing, and I have already forgotten it.

Let's get back to my trades.

I roughly have a probability of 3 out of 10 of getting a losing week on this whole sample:

Snap1.jpg

Since the losing weeks are randomly distributed (if I knew otherwise, I would simply disable trading during those weeks), every week there's a 30% chance of getting a losing week.

So, if all these assumptions are true (we can't find a better assumption, so we have to assume things as precisely as possible), this only allows us to say that after a losing week (just as after a winning week) we have a 30% probability of getting another losing week.

The fact that, on my sample, there haven't been any 3 losing weeks in a row, only means the sample is not long enough.

Their probability is 0.3 times 0.3 times 0.3 = 0.027. This means that every 100 weeks, there's almost 3 chances of such a losing streak happening. Do I have 100 weeks in my sample? Nope. Of course I also have the long back-tested sample, and I certainly have those losing streaks in it.

So, let's recapitulate.

The fact that I don't see any streaks of four weeks in a row doesn't mean they don't happen. The fact that I have behind me 2 unprofitable weeks in a row doesn't protect from a third one any more than if I had 2 winning weeks in a row behind me. It's all just a false feeling of security. This week I still have a 30% chance of having an unprofitable week.

Despite all this repetition, it still isn't clear enough, for whatever reason, and I know the gambler's fallacy will resurface in my mind, as it does in almost everyone's mind. E.g.: when people say that they're not likely to get a second tumor or be struck by lightning, because it already happened once - instead the chance is just the same as the first time it happened.

Yeah, the chance of three red weeks in a row is 3%, but not once two red weeks have already happened. Then the chance of it happening a third time is just that same 30%. Each time it's the same 30% that gets multiplied by itself.

[...]

I don't know why but after all this explaining and repeating, I still have a feeling of safety by having two negative weeks right behind me. I don't remember other situations where everything is telling me things are one way, and instead I keep thinking that they're the opposite.

Maybe it's close to the feeling of god. You feel there's a god, from years and years of inner thoughts, but then your reasoning tells you there isn't, but then you feel like there's someone listening to your thoughts, and instead it's just you. You feel there's someone else, too, and instead there's nobody. The same applies to this feeling of safety that you get from being struck from a lightning and surviving, or from surviving a drawdown, or from starting to trade after a drawdown. It's probably all imaginary.
 

Attachments

  • Snap30.jpg
    Snap30.jpg
    352 KB · Views: 207
Last edited:
Doing a whole lot better after today, because over 1000 dollars were made, so this means that if I do not scale up, as I won't do, the inevitable (sooner or later) drawdown is 1000 dollars farther from blowing out my account, and this is a lot. Tomorrow I will do the weekly update tomorrow, and show the ongoing equity line. For now the difference of over 1000 dollars in capital means going down one step in risk of blowing out the account:

Snap1.jpg

Whereas before, a 3000 dollars loss would have blown out my account, now I would need a 4000 dollars to stop me from trading (it wouldn't really blow out the account, but brings me below the trading minimum requirement).
According to relativized back-testing, by going from a capital of 4000 to a capital of over 5000, I brought my probability of survival from 88% to 93%. So, I could still blow out, especially considering that the future is worse than the past, but I am farther away from it in terms of probability.

One post earlier, I was talking about the gambler's fallacy, but even without that faulty reasoning that keeps haunting my thoughts, I can say this. The chance of having a third negative week in a row, counting from the start, was 0.3^3 = 2.7%, and it didn't happen. Counting from a week ago, the chance of it happening was 30%. I think I can say this much, coherently and without contradicting any probability theory. Of course, the only thing i am not taking into account is that past performance is never a guarantee of future performance (there's a tendency to do worse, as explained recently), and I am not mentioning it because, given that right now I cannot assess it with any formula, it's hard to make it fit into probability theory. I hope I'll find a theoretical way to assess it and describe it.

From experience, if the chance is 30% in the past, in the future, it becomes about 40%. This would mean, for 3 negative weeks in a row, a calculation that goes like this 0.4^3 = 6.4%.

Now the challenge for me will be to not rush things, by either scaling up or engaging in discretionary trading, both of which would have the effect of destroying my account. When things don't happen at all, I can be patient and wait months, as I did recently. When things start happening, like now, all of a sudden I get into a frenzy and feel tired of waiting and feel like rushing things. It's like when you are in the street on your way home and you can hold your urge of pissing all the way to the house, and then once you shut the door, you almost feel like pissing in your pants. That's because, unconsciously, as soon as you feel that something is possible, you stop holding your urge, and it almost overwhelms you. Until it's impossible, instead, you easily hold it. I remember it happened at school with the bell. You can stay in class, easily, until the bell rings. Once it rings, you feel the irresistible urge to get up and leave. And yet, it's so irrational, because you sat there for hours, without complaining and one more minute is not going to make a difference. But no one can hold it (you can see it in movies, too).

So, I should now try to hold my pissing money away, because the bathroom is still not at hand. The money is in the account, but it can't be relied on, it can't be spent, it can't even be considered part of the capital: it's the profit cushion necessary to withstand the drawdown. I shouldn't even resume taking taxis - as much as possible I should take the subway. Too many times, after making money trading, I treated people to that Japanese restaurant near the office. If you put yourself in a situation where you consider your trading profits as money in your pockets, you're not going to be ready for the drawdown when it hits you, and then you will try to make up for your losses, and then you will lose even more. When your capital is everything like in trading (it's different when, like for most people, you don't have to invest it), saving is everything, and it should be spent in % terms, like spending a % that doesn't affect it. Like 1% for example. Ideally 0%. I should try paying for the server from my other account, rather than from the IB one.

Somebody to Love - Jim Carrey (Cable Guy) - YouTube
 
Last edited:
Adizes Methodology (PAEI)

Adizes Methodology (PAEI) - PAEI - Structures of Concern

A trader friend told me to check out this classification of "business personalities" (your personality at the workplace). At the moment I am looking for a test. Probably one of these will work:
PAEI Software - ttware.com
PAEI Software 2.0 download free - PAEI model of Adizes Software, Framework Mana

PAEI Demo software-WeatherKing.avi - YouTube

I will look into it further once I get home.

[...]

Taxi driver strike. I could not get home with a taxi so I took a bus, the number 30, but in the wrong direction. So I did spend only 1 euro, but it took me 2 hours to get home.

You know what. I don't need to take the test, because well, first of all, none of the links I found works. Second of all, I am not going to install a "free trial" unknown software to just take a personality test. Third of all, the business type I am is one who doesn't need coaching or tests.

At any rate the first link, provided at the top of the page, is quite interesting:
Adizes Methodology (PAEI) - PAEI - Structures of Concern

Oh, and the youtube video actually had nothing to do with this subject. I pasted on the post from work, and when I am there, I cannot see youtube videos.
 
Last edited:
I am quite happy, excited and even euphoric. This week I made... 42%.

I did throw in a few NG discretionary trades this week, all profitable, but most of the money was made by the systems.

Chopin Nocturne Op. 62 #2 - Rock version - YouTube

Blowing out probability is now down to about 5%, according to relativized non-resampled back-testing:

Snap1.jpg

I can lose almost 4000 before blowing out the account. In reality, due to the future underperformance which tends to happen, risk is higher than 5%, probably at least 10%. But if I get another week like this, it's still going to be very small.

Things will go wrong sooner or later. What matters is how wrong and how soon.

Discretionary-wise, I shouldn't have been doing anything, but I did, it worked, and now I'm cockier than ever. This is what happens before I start a trade that goes wrong, and makes me blow out the account. Given that I got away with making about 500 dollars without blowing out the account, I should stop right here, because, unlike for the systems, when a discretionary trade goes wrong, I do not know how to cut losses, and it really means the end of my account.

The trades on the NG, I made them because it has been falling for 8 days in a row, and I carefully seized every opportunity of bouncing back, feeling it could not fall any lower. And I was right, but I won't always be right. And the cockier I'll get, the less I'll be right. And the more I'll be right, the cockier I'll get, therefore the more I'll be right, the more I'll increase my chance of being wrong. Therefore it's really time to stop. I've made some precious money, very needed to withstand the future drawdown. Now I can stop. Let's just stop. Let's quit while we're ahead. Let the systems take care of the rest.

Now i've got to get to work on finding a solution for my friend, who says he fears his wife is cheating on him, and asked me, as the technology expert, to tell him if and how he can listen to her cell phone conversations without her knowing it. This is going to require a lot of research. Hopefully it will be impossible, otherwise, if he goes ahead with it, work will call more work, and it will be all on my back. As usual. Because the idiots aren't capable of doing anything, so it's always the hard workers who do all the work, because they take the time to learn in the first place. The others never bother to learn and always ask others to do the work. So the stupid ones get more stupid, and the hard working ones get more burned out, on and on, until someone asks me for help once too many. That's when mother****ers accidentally get shot.
 
Last edited:
weekly update

Here it is: the last row (last cell) shows this week, but I started at the end of last week so that I actually lost only 100 of the 800 shown as a loss by the cell above. So, all in all, a profit of over 1000 from automated trading since I started:

Snap1.jpg

And a profit of about 500 from discretionary trading. And a profit of almost 100 from keeping the account in euros. Another week like this and I'll be very safe (not guaranteed, that's never the case) from the risk of blowing out.

Chopin´s Fantaisie Impromptu - guitar version (part II) - YouTube

Nocturne Op. 9, No. 2 / Frédéric François Chopin / Cover by Hito - YouTube

CHOPIN'S NOCTURNO by FRÉDÉRIC CHOPIN - bass tapping and guitar and slap bass solo - YouTube

Ron Thal (bumblefoot) - Chopin Fantasie - YouTube

Chopin Nocturne Op. 62 #2 - Rock version - YouTube
 
Last edited:
After following Travis a couple of years, I was yesterday presented to his system and work. Must say
I´m impressed, was partly expecting some primitive approach, but found a well developed trading system which indicates many years of hard work and effort, at a level seen at hedge funds and institutional market players.

I was presented with a count of strategies ( of a pool of 120 ) running at a dedicated server, with the IB Trader Workstation as gateway - with open positions and all running. Very nice indeed Travis, this has cost you a lot of work and persistence.
 
Last edited:
Thanks for the feedback and for bringing our discussion on this journal, as I had suggested.

It's nice to see that every once in a while someone is capable of appreciating my work, and takes the trouble to tell me. It feels great. As I said in our chat, it would be nice if, whenever possible, we could continue our discussion of automation and trading systems here, because my 10 readers are interested in this topic, and also would be interested to hear what you are doing with your software. That way our efforts benefit others, and also we might get some useful feedback.

I realize that, as many banned readers know, it's hard to get along with me because I get very offended very easily, but if others join in, the conversation can continue without the need for my intervention and that way I won't take everything personally, especially if two other people are talking to each other. Yet I'll still read and learn something.

We should start anyway, because i found out through experience that if two people have an interesting public conversation (rather than one person having an interesting monologue), others will yearn to join it, and definitely read it. This happened recently, in September, when I was chronicling the trouble with our portfolio theory and the expected drawdown being exceeded (which caused the end of a business relationship). There was a lot of interest and some interesting posts back then. Unfortunately, within two months things escalated, because I got enraged that other people who shouldn't have talked did talk, superficially. This really bothers me. I cannot accept that after all these years of work others dare to spit on my work without even having spent one hour studying it seriously. Especially... go ahead and spit on my work but at least not on my own journal. But now this is taken care of, because with the "only posts from contacts" option, I can't really find any unpleasant surprises.

So the first issue we could address is the main one of our chat today, and we should clarify from the start that we have different points of view on it. Or rather, we didn't talk very much about our differences, but as you were explaining me your work, I was thinking my objections in my head.

You are working on a software that aims at simplifying the creation, backtesting and automation of trading algorithms, via a visual approach (straight on the chart). And this is nice and it will be useful to a large number of people. My objection is that, by relying on a software to do all this work for me, I may indeed get to the objective faster, but I may also lose touch with what I am doing exactly. My approach instead aims at keeping things so simple that I can do all the same things, with the same speed, and yet at the same time I can keep under control every possible consequence of my choices. I realize my backtesting on Tradestation and live trading with TWS + Excel solution is considered obsolete, slow and ineffective by many programmers and even by IB, here:
http://www.interactivebrokers.com/en/software/highlights/apiHighlights.php?ib_entity=uk
Limited; uses obsolete technologies; lower performance.

I am just saying I absolutely find it optimal for me at this point. If I were to start all over again, I probably would not do it. My first step would be to find out what the majority of automated traders are using (provided it's simple), in terms of broker and software, and then I'd go that way, because I found that, as far as trading, where there's people, there's quality, and convenience (for example, IB). The same doesn't apply to everything, for example movies. The movies that aim at big crowds and get big crowds are definitely not the best movies:
List of highest-grossing films - Wikipedia, the free encyclopedia

But with software and brokers there's economies of scale and therefore the fact that a lot of people have it, other things being equal, is a quality in itself.

So anyway, my argument is that this software might not be a good idea for everyone, at least for me. But another question I would have is this: why should we create a software that helps people build systems which they'll use to beat us? I want to make money, so if anything, I should try to sabotage your work. But I think I know the answer: it's a great tool, but if you don't have the trading ideas, you still won't make any money (it would not be a good marketing message though).

For now I'll stop with these two thoughts. Feel free to reply soon, late, or never. Sometimes I write for the sake of writing, because the process of writing clarifies my thoughts and makes me reason.
 
Last edited:
Excellent tutorial on math (I've already mentioned it many times before) and in this case combinatorics, maybe even clearer than khan academy's videos:
Combinatorics - Algebra 2 - Brightstorm

The only problem with this website is that you are not given exercises. You're given sample problems, and shown the answers, but it's not the same as khan academy's infinite computer-generated exercises. But for probability khan academy only has these two exercises:
Dependent probability | Khan Academy
Probability 1 | Khan Academy

I just found another good course on probability, even though it's mostly (good) lectures and therefore not easily searchable:
Sets, Counting, and Probability - Free Harvard Courses

Speaking of probability tutorials, here's another one (actually I'd like to do this lady, there's something very sexy about her):

Math Probability - YourTeacher.com - Pre Algebra Help - YouTube

However, I can't spread my energies in all these directions, so I will set aside all probability tutorials for now and focus on the statistics tutorial, which is very long. I need to speed up on it, because I want to finish it and I didn't even cover one third so far:
Scales of measurement in statistics

The problem with these stat trek lessons is that they're very very boring. They are clear and concise, but still boring. Probably this material could not be covered any better. Probably it's just that probability is more entertaining than statistics.
 
Last edited:
This stat trek tutorial is basically a boring book, but it has the advantage that it's read out loud by someone, and this makes it easier to digest:
AP Statistics: Linear Correlation

The regular lesson is here:
AP Statistics Tutorial: Linear Correlation and Linearity

But they do not have enough exercises. Too much theory and too little practice. Other than that, this website is very conscientious and serious work. I am really grateful to them.

In this case the lesson is on correlation, so despite the website being too much theory and too little practice, since it's very useful for my trading systems, I will understand it and listen carefully, as I need to trade uncorrelated systems, or even better, negatively correlated systems. I might come up with some new ideas on how to measure correlation between my systems. I probably will.

[...]

There you go. At minute 5, it talks about using scatter plots to detect the linear relationship between two variables. Here's my systems with their sharpe ratios on the y axis and number of trades on the x axis:

Snap1.jpg

The more the trades, the less extreme are the sharpe ratio values. If they all went to zero, then my systems would be random and have no edge. Luckily it's not the case, the sum of the profit is 80k, and the majority of systems are profitable and therefore have a positive sharpe ratio.

We could say there's a tendency for sharpe ratios, at the same time, to increase and decrease, as the trades increase. If we split the two groups in 1) systems with profitable sharpe and 2) systems with negative sharpe ratios, for the systems with positive sharpe ratios, we could say they have an inverse correlation with the number of trades, and for the second group, we can say they have a positive correlation, in that their sharpe ratios increase as the number of their trades increases.

Let's now consider the excel's "correl" function. Given that the relationship is both negative and positive, depending on the points, what will that function return?

I think it will return zero.

Let's check.

0.08

Pretty good prediction.

Hey, but this is also telling me that, by splitting my data, I saw a negative and positive correlation which the function did not detect. So I have to be careful in the future.

Oh, wait, I just heard at minute 7:50 that the "Pearson product-moment correlation only measures only measures linear correlation". Here, too, there's something about it (it says the correl function is equivalent to Pearson's):
Excel CORREL Function

So, there can be a relation that is not measured by the Pearson function, because it's not linear.

Just in case, let's split the data between positive and negative sharpe ratio and see if the correlation gets detected, as I think it will.

Perfect. The positive sharpe ratio systems have a negative correlation of -0.31, and the negative sharpe ratio systems have a positive correlation of 0.26.

So what does this teach me? A lot. It tells me that a system with a sharpe ratio of 2 and 50 trades is better than a system with the same sharpe ratio and just 20 trades.

So, according to this new knowledge these are my best systems circled in red, and second best circled in green.

Snap2.jpg

This is almost exactly the systems I am trading, so subconsciously I had understood the fact that systems with lower sharpe ratios and more trades are just as good as systems with higher sharpe ratios and fewer trades.
 
Last edited:
geniuses of dry humor

Deadpan - Wikipedia, the free encyclopedia
Deadpan is a form of comic delivery in which humor is presented without a change in emotion or body language, usually speaking in a casual, monotone, solemn, blunt, disgusted or matter-of-fact voice and expressing an unflappably calm, archly insincere or artificially grave demeanor. This delivery is also called dry wit[citation needed] when the intent, but not the presentation, is humorous, oblique, sarcastic or apparently unintentional.

What is Dry Humor?
Often referred to as deadpan humor, dry humor is a comedy technique that is characterized by a calm and straightforward delivery by the performer.


Ali g with shaq - YouTube

Ali G- UK education - YouTube

Brüno: Austria Gay TV - YouTube

Borat - Dating Service Skit - YouTube


Between Two Ferns with Zach Galifianakis: Charlize Theron - YouTube

Between Two Ferns with Zach Galifianakis: Conan O'Brien & Andy Richter - YouTube

Between Two Ferns With Zach Galifianakis: Natalie Portman - YouTube

Between Two Ferns with Zach Galifianakis: Michael Cera - YouTube


Joaquin Phoenix Bizarre Interview on Letterman: The New Andy Kaufman? @mjdasilva - YouTube

Andy Kaufman, Joaquin Phoenix, and the Two Lettermans | Blogs | Vanity Fair
Joaquin Phoenix versus Andy Kaufman - latimes.com

Andy Kaufman on Letterman (June 24th 1980) - YouTube
 
Last edited:
Top