My FX pairs And Gold Daily Analysis

Dominic Walsh

Active member
Messages
130
Likes
0
My name is Dominic, I am going to post my daily trading analysis. I hope you will find those useful :)
 
Gold started a correctional movement.
Here is my latest structure analysis.

Horizontal Structures

Support 1: 1896 - 1904 area
Support 2: 1864 - 1879 area
Support 3: 1817 - 1832 area

Vertical Structures

The major rising trend line
 

Attachments

  • gold.jpg
    gold.jpg
    74.7 KB · Views: 18
USDCAD is trading on a key level.
The market was rejected multiple times from that.

I believe that we may see a pullback soon.
Goals: 1.3355 / 1.3376
 

Attachments

  • usdcad.jpg
    usdcad.jpg
    58.7 KB · Views: 17
GBPAUD broke a key daily demand zone last week.
This week, we saw its retest.
The market was nicely rejected from that, confirming its strength.

I expect a bearish move to 1.7317 / 1.7255
 

Attachments

  • gbpaud.jpg
    gbpaud.jpg
    52.2 KB · Views: 15
NZDCAD broke and closed below a major rising trend line on a daily.
It may push the price lower.

Next support: 0.8457
 

Attachments

  • nzdcad.jpg
    nzdcad.jpg
    57.3 KB · Views: 13
USDJPY reached a major falling trend line on a daily.
Even though the market was consolidating with a horizontal range for some time,
the touch of the trend line pushed the pair to the downside.
The market broke and closed below the support of the range.

I believe that the pair will keep falling.
Goals: 127.77 / 126.85
 

Attachments

  • usdjpy.jpg
    usdjpy.jpg
    74.4 KB · Views: 17
AUDUSD reached a key daily structure resistance.
The price formed a triple top pattern on that 1H time frame and has just broken its neckline.

I think that the market will retrace from the underlined area.
Goals: 0.7096 / 0.7059
 

Attachments

  • audusd.jpg
    audusd.jpg
    66.6 KB · Views: 17
GBPUSD was consolidating on a key level within a horizontal trading range for some time.
Yesterday, its support was finally broken with a high momentum bearish candle.

I expect a further bearish continuation.
Goals: 1.213 / 1.202
 

Attachments

  • gbpusd.jpg
    gbpusd.jpg
    63.1 KB · Views: 18
EURCHF reached a key supply area.
The price was coiling for some time on that forming a horizontal trading range.
Its support has been just broken.

I believe that it will push the pair lower.
Goals: 0.9948 / 0.9926
 

Attachments

  • eurchf.jpg
    eurchf.jpg
    54.6 KB · Views: 17
EURUSD set a new higher high higher close on a daily time frame again.
The price has successfully violated 1.091 - 1.093 horizontal resistance.

Now the price retraced.
I will expect the next bullish wave from a confluence zone based the underlined horizontal structure
and a major rising trend line.

Goals: 1.103 / 1.11
 

Attachments

  • eurusd.jpg
    eurusd.jpg
    66.9 KB · Views: 15
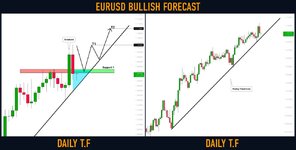
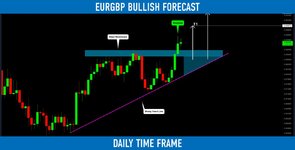
EURGBP formed a huge ascending triangle on a daily time frame.
The price was nicely respecting its horizontal neckline for some time.
It was finally broken yesterday with a strong bullish candle.

Now, the broken neckline of a triangle and its trend line compose a contacting demand area.
I suggest waiting for an occasional retest of that area, expecting a bullish continuation.

Goals: 0.9 / 0.95
 

Attachments

  • eurgbp.jpg
    eurgbp.jpg
    60 KB · Views: 15
USDCHF reached a key daily structure resistance.
The pair looks too overbought now.
The price formed a double top pattern with a lower high on 1H time frame
and broke its neckline.

I expect a pullback to 0.92 / 0.917
 

Attachments

  • usdchf.jpg
    usdchf.jpg
    61.2 KB · Views: 14
NZDJPY is trading within a wide horizontal trading range on a daily.
The price was stuck on its upper boundary for 2 weeks.
A double top pattern was formed.

The price has successfully violated its horizontal neckline last week.
I believe that the pair may go lower.

Goals: 82.4 / 81.6
 

Attachments

  • nzdjpy.jpg
    nzdjpy.jpg
    57.2 KB · Views: 15
I spotted a great example of a bullish reversal on 🟢USDJPY.
The pair formed a double bottom formation on a daily time frame
and broke a resistance line of a falling parallel channel.

The underlined blue area is a buy zone based on a broken neckline and a trend line.

The pair will most likely keep growing to 134.4 / 137.63 levels.
 

Attachments

  • usdjpy.jpg
    usdjpy.jpg
    64.6 KB · Views: 13
EURJPY dropped nicely from a key daily structure resistance.
I think that the pair can go even lower.

I expect a bearish move to 140.14
 

Attachments

  • eurjpy.jpg
    eurjpy.jpg
    59.7 KB · Views: 14
The price has nicely respected a major rising trend line and the price successfully broke a neckline of an ascending triangle formation on 4H.

I will expect a bullish continuation now.
Targets: 1895 / 1908
 

Attachments

  • xauusd.jpg
    xauusd.jpg
    54.2 KB · Views: 15
CHFJPY has recently broken a key daily supply area.
The broken structure turned into a demand zone.

Approaching that, the price formed a double bottom formation and broke its neckline then.
I opened a long position early in the morning on a retest.

Now a bullish continuation is expected to 142.7 / 143.05
 

Attachments

  • chfjpy.jpg
    chfjpy.jpg
    66.8 KB · Views: 13
USDCAD reached a key supply zone on 4H.
The price formed a double top on that and broke its neckline at night.

I expect a bearish movement to 1.3349 / 1.3295
 

Attachments

  • usdcad.jpg
    usdcad.jpg
    62.3 KB · Views: 12
EURCAD was consolidating for 3 weeks in a wide horizontal trading range on a daily.
Its support was finally broken this week.

I believe that the pair may go lower now.
Next support - 1.428
Forex Trading Strategies
 

Attachments

  • eurcad.jpg
    eurcad.jpg
    62.1 KB · Views: 12
USDJPY is testing a key horizontal demand zone on 4H.
The price formed a double bottom pattern on that and broke its neckline then.

I expect a bullish movement to 132.7
 

Attachments

  • usdjpy.jpg
    usdjpy.jpg
    59.5 KB · Views: 11
Top