Long position on BA ?

kkarank

Junior member
Messages
42
Likes
0
Hi ,

I am working on my paper trading and would like some QA on my analysis .

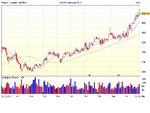
Step 1) I looked at the one month ADX for BA and it is showing ADX around 40 and the DMI+ significanltly above DMI- This indicates an uptrend ?

Step 2) Identify if I should go long/short in the short term as the price range is high for BA.
For this i first look at today's chart and see that

a) CCI is below 100 which means that it might be a good time to go long as the long term trend is bullish ?
b) momentum indicator reads -5 and this to me means that the recent rally upwards is loosing steam .Is this correct ?
c) the 5 day chart confirms points a and b above.

Steps 1 & 2 above tell me that since the monthly trend is bullish i have a good trading opportunity.I now need to find at what price i should place the long order.

The daily/15 min chart is here -

untitled.jpg


What i would like to ask is that in this chart the DMI- line is above the DMI+ line - does this mean that the price is likely to fall further before a bounceback ?should i wait or place ther order at the current price of 435 ?

Thanks all.
 
For what it's worth.......... this is well into it's bull market .......... if it was me I'd wait for a decent pullback to get in ............ but you've got a spike low today at 430 so very short term it might go up .....

Sorry ,I've got an aversion to buying so near a 52 week high - one of the many flaws in my character...

HS
 
Hook Shot said:
For what it's worth.......... this is well into it's bull market .......... if it was me I'd wait for a decent pullback to get in ............ but you've got a spike low today at 430 so very short term it might go up .....

Sorry ,I've got an aversion to buying so near a 52 week high - one of the many flaws in my character...

HS

true ,but on a one month chart the momentum seems to be looking pretty healthy ? also mind you this is a swing trade and i am quite happy waiting for another couple of weeks for the target price which in this case i have kept at 455 - stop loss at 425 - giving me an RR of 2.16 with 1000 shares.

i am looking at disecting my decision to enter this trade so do let me know what technical analysis would you have done if you did want to buy this stock.If 455 in two weeks too aggressive ?

cheers
 
Hi kk,

I don't trade UK stocks as you know, but just as observation, I would say that you're really overloading your chart with too many indicators.

Please don't think I'm being critical - it is just an observation.

A quick glance at your chart shows me: a Moving Average, ADX, DMI, CCI, and Momentum - that's 5 indicators before you even start looking at the price itself and the daily volume.

Seriously, my advice would be to cut down on the indicators because you're going to confuse yourself and suffer from information overload.

One thing I will say however, is that you have calculated precise entry and stop prices with a risk/reward judgement as well, which is excellent.


Good Luck

Damian
 
kkarank said:
should i wait or place ther order at the current price of 435 ?
Hi kkarank,
I notice you've started a number of threads since you joined T2W which are quite disparate. There's nothing wrong in this and I'm not criticising, but it suggests to me that your thought processes are darting off in many different directions. Perhaps, like me, you are a Sagitarian? ;)

May I suggest that you start by focusing on your trading objectives and, specifically, a time frame that works for you. If you have a full time job, then day trading is going to be tricky (but not impossible). You will need to look at your attitude towards risk which will help you to focus on which markets to trade and then to drill down to individual instruments within those markets. Once you have a clear idea of what you want to achieve and a reasonable idea of how you're going to achieve it, then these boards are a great place for getting ideas and suggestions to help resolve the niggling details. However, canvassing opinion as to how members interpret indicators and at what price to enter won't help you much, I suspect. If you're going to use indicators, then it's wise to know how they are calculated and the information that they impart. How I or another trader uses RSI, CCI or whatever may be very different from the way you choose to use them. As you appear to be using most of your indicators to establish the trend, I wonder what you think they all tell you that your eyes and possibly a simple moving average don't? The link below will set you on the path to answering some of the basic questions that I've touched on here:
http://www.trade2win.com/boards/showthread.php?t=16681

If you're interested to know how other traders might swing or position trade BAY, then you might like to pose the question with a daily and/or weekly chart here:
http://www.trade2win.com/boards/showthread.php?t=12009&highlight=swing+trading
If you don't want to develop your own strategy you could follow one of the many tipsters. Quite a few of them post regularly on T2W in the hope of attracting custom. Perhaps you're their next victim. Sorry, I meant to say client!

Good luck,
Tim.
 
timsk said:
As you appear to be using most of your indicators to establish the trend, I wonder what you think they all tell you that your eyes and possibly a simple moving average don't?
Weekly Chart of BAY attached with 50 and 200 simple moving averages. Trend is clear but, like Hook Shot, I wouldn't want to be long this stock right now. When price becomes detached from the shorter term moving average which, in turn, diverges away from the longer term moving average, the probability of some kind of correction increases the longer this situation persists. That's not to say that price won't go higher. It very well may. Either way, don't be influenced by what I say - you decide for yourself.
Tim.
 

Attachments

  • BAY_Weekly.jpg
    BAY_Weekly.jpg
    108.1 KB · Views: 438
timsk said:
Weekly Chart of BAY attached with 50 and 200 simple moving averages. Trend is clear but, like Hook Shot, I wouldn't want to be long this stock right now. When price becomes detached from the shorter term moving average which, in turn, diverges away from the longer term moving average, the probability of some kind of correction increases the longer this situation persists. That's not to say that price won't go higher. It very well may. Either way, don't be influenced by what I say - you decide for yourself.
Tim.

Tim

Thanks for the post :)

not sure about what is disparate in my posts and also not sure how posting this thread under UK shares is less advisable than posting it on swing trading.also not sure as to how there can be too much difference between views of senior members on the same set of indicators .also just to let you know that i am not posting blanket,uninformed questions without having read the basic material :cool: but i will be generous to the message you might be trying to give here :)

i def. dont want to day trade and was looking at taking swing positions-still in the paper trading stage.the reason i post here is because having read my theory i want to put it to use and seek guidance from veterans(who might be willing to provide one) as to whether i am on the right track - that is what these forums are about - i thought.

by the way - thanks for your analysis of the BAY graph - as i said i am into swing trading and the long term outlook of the share is an uptrend,this included my own analysis and that of some professionals who have put the resistance at 470 - i dont mind minor corrections on the way as have my stops just in case.

cheers :)
:cheesy:
 
kkarank said:
Thanks for the post :)
My pleasure!

kkarank said:
not sure about what is disparate in my posts and also not sure how posting this thread under UK shares is less advisable than posting it on swing trading.
Disparate is too strong a word - sorry. What I was driving at is that I noticed you've also started a thread relating to the U.S. markets. While there's nothing wrong in trading different markets, it is best done by traders with a fair amount of experience - and profitability - under their belts. For the less experienced trader, focusing on one market will make the whole process (slightly) less complicated.

The point about posting your chart and query in the thread I linked to - or one similar - is merely that it is a thread created for the purpose, is heavily subscribed to and has a large number of hits. Therefore, your post is likely to enjoy greater exposure there - than it is here - if you see what I mean.

kkarank said:
also not sure as to how there can be too much difference between views of senior members on the same set of indicators.
Okay, two things. First, the 'senior members' tag is meaningless in terms of trading skills and ability - so don't pay too much attention to the label. Second, the way indicators are calculated and the type of information that they impart is constant. The difference of views between one trader and the next lies in the way that the indicator is used. They can be used as a primary or secondary buying or selling trigger, or necessary part of a set-up, or as a mechanism for taking profits or pyramiding existing positions etc., etc. The way you interpret RSI - for example -and the settings you use will be different to the way another trader uses RSI.

kkarank said:
also just to let you know that i am not posting blanket,uninformed questions without having read the basic material :cool: but i will be generous to the message you might be trying to give here :)
Glad to hear it! ;)
Sorry for not explaining myself more clearly in my original post.
Tim
 
Last edited:
timsk said:
Glad to hear it! ;)
Sorry for not explaining myself more clearly in my original post.
Tim

think i get the message :)

took the advice and waited the last two days and the price of BAY DID come down to 430 today - have placed a CFD order for 700 units with barclays at 431.25 - keeping it simple and small and will exit if it gets to 440 - very small RR i know but it gives me confidence in that my analysis is on the right track !

kk :cool:
 
Top