Here is the way i daytrade the Emini-YM

Hi Bashir,

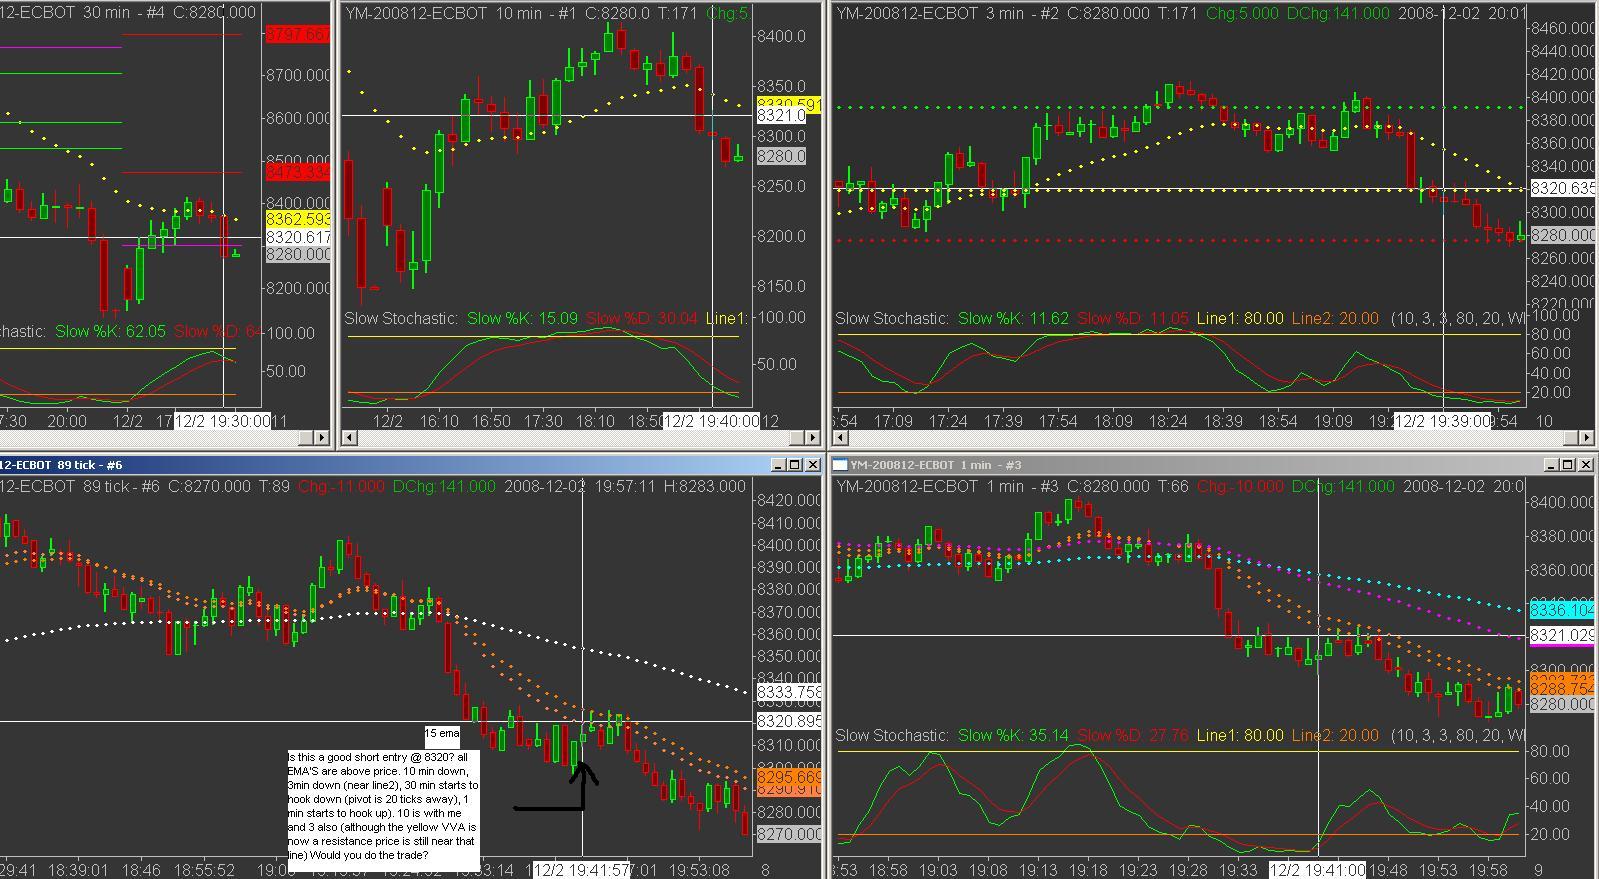
Both these trades were done with 1 m stochastic going against you. To quote from the rules:


Also, in the second trade, the 1 m stoch is oversold.

Could you clarify?
Also are you still using the Pivots? I think you mentioned earlier that when all the stochs are on your side, the pivots will be broken.

Thanks!


Those are two different trade,there is 1 type trade that is taking as a retracement, and there is another one that is taking right when price moves.

Type1 trade: You take it right on the 15ema on the 89tick chart, at this trade you always need the stochsatics with you.And you exit when the 1min is getting oversold.

Type2 trade(main trade): You take the pullback to the 15ema, as long as the 3min +10 is on your side you take the trade, regardless if the 1min is going against you.

I think if you read carefull mentioned that there?
If i have not , then i apologize for that.


The type 1 trade is the one that you take to get the move down, and you dont waste time to get into itwhen using 15ema on the 89tick, the main trade is then taking against the 1min, if you would wait for the 1min to turn down first, you will give away alot of the move and your stop would be in a much worse place.

I hope this makes sense?


I am still having the pivots on mycharts, even though u are sure that the price will break, its nice to know where you can expect resistance, so you can enter the trade at the best possible place. So its still somethng you need, evethough if ur 100% sure it will break.


Wiith kind regards
Bashir Naimy
 
Hi guys - following this thread on the side with great interest - just some info on the GMMA:
"Guppy Multiple Moving Average" named after an Australian Trader Darryl Guppy.
From memory he's on CNBC as a technical analyst.

p.s Bashir not many in this world would help people the way you are here, well done to you and i wish you much success.

Thanksfor that ifo m8, apprittiate it alot.

Can you imagine anything more giving then helping fellow traders, i cant :)
I think alot of traders are walking around thinking that if they reveal their trading method then it would just make that method not work anymore, and that is try to some extend, but only if its very little marked with little volume.Or why they should part with something they have lost alot of money one to perfect and that they should go true the same pitfalls and hurdles before getting to a profitable level.

I guess its just human nature and hard to kill :D

And they forget that there are many many marked and billions of billions money flowwing around and there will never be that many using the same method. Everybody have their preference.

YOu can give 100 000 traders a method and everyone will trade it differently, even with rules. Overtime they will bend the rules so that it fits their tradin style and psycologie.
Nothing wrong in that if it works,thats all that matters.And there is endless ways of trading the marked.They most importent part is being on the right side when doing the trade :LOL:

With kind regards
Bashir Naimy
 
Hi Bashir,

Sorry to ask you again, but the question was not answered (and I understand it... it is amazing how you get the time and the good will to answer all).

The plataform I use to trade does not offers me a tick chart. What can I do to make your setup usefull?

Regards

Jordao
 
Gmma

It seems the original GMMA indicator uses the following Ema's:
Short term Ema 3, 5, 8, 10, 12, 15
Long term Ema 30, 35, 40, 45, 50, 60


The one described in the link we have on this thread uses:
Short term Ema 3, 5, 7, 9, 11, 13
Long term Ema 21, 24, 27, 30, 33, 36


Anyone know why the one mentioned in this thread uses alternate moving averages? Is the one we're using focused more on short term trading?
 
Those are two different trade,there is 1 type trade that is taking as a retracement, and there is another one that is taking right when price moves.

Type1 trade: You take it right on the 15ema on the 89tick chart, at this trade you always need the stochsatics with you.And you exit when the 1min is getting oversold.

Type2 trade(main trade): You take the pullback to the 15ema, as long as the 3min +10 is on your side you take the trade, regardless if the 1min is going against you.

I think if you read carefull mentioned that there?
If i have not , then i apologize for that.


The type 1 trade is the one that you take to get the move down, and you dont waste time to get into itwhen using 15ema on the 89tick, the main trade is then taking against the 1min, if you would wait for the 1min to turn down first, you will give away alot of the move and your stop would be in a much worse place.

I hope this makes sense?


I am still having the pivots on mycharts, even though u are sure that the price will break, its nice to know where you can expect resistance, so you can enter the trade at the best possible place. So its still somethng you need, evethough if ur 100% sure it will break.


Wiith kind regards
Bashir Naimy

Bapovs,

From the images it looks to me like you made those 2 trades based on the 89 tick chart. Can you confirm you made them based on the 1 min?

Cheers
 
It seems the original GMMA indicator uses the following Ema's:
Short term Ema 3, 5, 8, 10, 12, 15
Long term Ema 30, 35, 40, 45, 50, 60


The one described in the link we have on this thread uses:
Short term Ema 3, 5, 7, 9, 11, 13
Long term Ema 21, 24, 27, 30, 33, 36


Anyone know why the one mentioned in this thread uses alternate moving averages? Is the one we're using focused more on short term trading?

Those are minor changes santana that the person who posted it have done, and it will not affect the trading that much, with the ema's that he have shown will get you into a trade faster.Because we are using it for intraday trading, if you are looking for long term trading then you can use those longer setttings, but try them out and see what works best for you okey.

With kind regards
Bashir Naimy
 
Bapovs,

From the images it looks to me like you made those 2 trades based on the 89 tick chart. Can you confirm you made them based on the 1 min?

Cheers

Hi Laserwolf,


The file with the name ''good entry 1'' is based on the 89 tick chart. It's a coincidence that the EMA's are almost at the same level. I looked for the first oppertunity after all the signes were green, trying to catch the first retrace on the 89 tick chart.

to refer to Bashirs text:

''Type1 trade: You take it right on the 15ema on the 89tick chart, at this trade you always need the stochsatics with you.And you exit when the 1min is getting oversold.''

The other file is based on the 1 min chart because we had already an early entry and after that you look for a retracement to the 15 EMA on the 1 min, still all signes are green so that triggered a sell.

to refer to Bashirs text:

''Type2 trade(main trade): You take the pullback to the 15ema, as long as the 3min +10 is on your side you take the trade, regardless if the 1min is going against you.''

Sebastian
 
See attachment.

Text is in the attachment.

All signs were green. Took a 89 tick retrace short! I was only at max 9 ticks above my entry, after that it went straight down. Was also looking at the GMMA and was also down...
Could have gone short at the 15 EMA on the 1 min but was to happy with my first trade.

at one time (doubt trade) i was not so conviced, can you take a look at it?
1,3 min were overbought, would you have taken the trade?

Thanks again Bashir


ps2. Bashir, when looking at the pivots it seems that the purple line has not so much influence as the green and the red one. What is your opinion about it?
 

Attachments

  • Nice trade.JPG
    Nice trade.JPG
    261.4 KB · Views: 247
  • doubt trade.JPG
    doubt trade.JPG
    243.5 KB · Views: 224
Last edited:
See attachment.

Text is in the attachment.

All signs were green. Took a 89 tick retrace short! I was only at max 9 ticks above my entry, after that it went straight down.
Could have gone short at the 15 EMA on the 1 min but was to happy with my first trade.

cheers guys, up to the next trade!

Thanks again Bashir
ps. Was also looking at the GMMA and was also down...

ps2. Bashir, when looking at the pivots it seems that the purple line has not so much influence as the green and the red one. What is your opinion about it?

Nice trade Bapovs, but my charts are completely different. Probably due to having pre-market data.

I'm sure bashir has pre market too. have you changed your stochs to Wilders?

p.s Bapovs, I took that trade you doubted but went light with 2cars instead of 4, got my targets of +10 +30. Well done on spotting them
 

Attachments

  • Bapovs Compare.doc
    851 KB · Views: 285
Last edited:
Nice trade Bapovs, but my charts are completely different. Probably due to having pre-market data.

I'm sure bashir has pre market too. have you changed your stochs to Wilders?

Hi Clickstra,

I have the stoch Wilders amd no premarket, because the pivots, StochWilders and the EMA's are taking some of there calculation from the premarket then. There is almost no volume in the premarket so the calculation would be misleading.

I have the market times set to:
OPEN: 15:30:00
CLOSE: 21:59:59

For the timezone in the US that would be:
OPEN: 09:30:00
close: 15:59:59

ps. I see that you dont have an EMA 20 or EMA 15 in your tick chart. I only see one EMA? Is that an updated rule?
 
Yes I have 15 and 89 ema on tick chart. i was just worried about the way the stochs were pointing at the time of your trade completely opposite, lol.
Ok I'll check the time zones.

p.s. just got another retracement to the ema on tick chart! Way to go!
 
Hi Laserwolf,


The file with the name ''good entry 1'' is based on the 89 tick chart. It's a coincidence that the EMA's are almost at the same level. I looked for the first oppertunity after all the signes were green, trying to catch the first retrace on the 89 tick chart.

to refer to Bashirs text:

''Type1 trade: You take it right on the 15ema on the 89tick chart, at this trade you always need the stochsatics with you.And you exit when the 1min is getting oversold.''

The other file is based on the 1 min chart because we had already an early entry and after that you look for a retracement to the 15 EMA on the 1 min, still all signes are green so that triggered a sell.

to refer to Bashirs text:

''Type2 trade(main trade): You take the pullback to the 15ema, as long as the 3min +10 is on your side you take the trade, regardless if the 1min is going against you.''

Sebastian

Hi Sebastian

I am not sure "Good Entry 1" followed the rules for 89 tick entry, because the 1 min was against you and also oversold. (Coincidentally, i think you could take a trade on 1 min retracement)

Perhaps Bashir can clarify.

Thanks, I think it's very helpful to compare daily action like this!
 
Yes I have 15 and 89 ema on tick chart. i was just worried about the way the stochs were pointing at the time of your trade completely opposite, lol.
Ok I'll check the time zones.

p.s. just got another retracement to the ema on tick chart! Way to go!

I saw in Bashir's video that he was the settings from 09:30:00/16:30:00
I don't know why he has the last 30 min in his chart because spot market closes at 15:59:59 and the future market stops 15 min after the spot, 16:14:59 ad then the future market is closed.

Maybe he can clarify that?
 
To clarify all the rules here is my short version for the traders that are a bit familiar with Bashir's trading style:

Rules for long:
-Price above all EMA’S on the 1min, 3min,10min,30min, on the 89 tick chart it must be above the 89 EMA
-stochastics on the 3min, 10min must be up.
~If 30min is also up then take more cars.
~If only 10 min is up then take your normal cars.

When to enter:

1:
If 1min, 3min charts stochastics are up, buy at the 15 EMA on the 89 tick chart.
~When stochastics on the 1 min. looks heavy/crossing down, exit position.
2:
Look for a pullback to the 15 EMA on the 1min. chart.
~Make sure that the 3 min. stochastics is still up.
Note: 1min. stochastics might cross and starts to go down. Don’t bother, make sure the 3min. and 10min. stochastics are still with you.
3:
If 3min. Stochastics is crossing against you then don’t do the trade. Wait to see the 1min. chart to break the 50 EMA. If the price stays above the 50 EMA on the 1min. chart then wait until the 1min. and the 3 min. starts to hook back up.
~Take the trade at the 15 EMA on the 89 tick chart
Note: Make sure that the price is above the 89 EMA on the 89 tick chart.
Exit the trade when the 1min. goes against you.
*Make sure that you always have the 10 min. chart with you.*
When entering the next trade, wait for the pullback to the 15 EMA on the 1 min. chart.


Avoid:

1:
Price is 20 points below (long) or above(short) a pivot point.
2:
Price is 20 points below (long) or above(short) a VVA (volume value area).
3:
Trading within the first 15 min. and last 30 min. of regular trading hours.

For "Good Entry 1" , can we agree that the 1 minute is against you (and is also oversold)? That would be against the rule:

When to enter:

1:
If 1min, 3min charts stochastics are up, buy at the 15 EMA on the 89 tick chart.
~When stochastics on the 1 min. looks heavy/crossing down, exit position.
 
First entry is good, i recommedn you remove the midline (yellow), i am more concerned about the green and the redline now, they work alot better as resistnace and support. the Yelow line workds more like a equalibrium for price, where both sellers and buyers are happy. SO remove that line, but always trade with the stochastics,

So the first trade was a good one and the second trade was even better, text trades both of them m8 (y)

YOu are really doing this well and seem to really understand how this is done, i think your will do great.

With kind regards
Bashir Naimy

To Laserwolf and Bashir

For ''good entry 1'', can we agree that the 1 min is going against you (and is also oversold)? That would be against the rule:

Quote:

When to enter:

1:
If 1min, 3min charts stochastics are up, buy at the 15 EMA on the 89 tick chart.
~When stochastics on the 1 min. looks heavy/crossing down, exit position.


It's true Laserwolf, i don't know if Bashir has overlooked the 1min?
But all other stoch were down, we were below 30 min pivot and market looked weak. So i would suggest it was a good trade?

here is the link to the attachment:

http://www.trade2win.com/boards/attachments/day-trading-scalping/44008d1228245781-here-way-i-daytrade-emini-ym-good-entry1.jpg

I believe Bashir was looking at the retracement in the 1 min. It looks like there is a trade there which follows the rules. Just that since you were looking at the 89 tick, you were taking the good trade but maybe for the wrong reason. ;)
 
Congrats. Fantastic thread :clap::clap::clap:

100.jpg


lol, just notced, post nr 800 in this thread, let's make it 1K
 
Congrats. Fantastic thread :clap::clap::clap:

100.jpg


lol, just notced, post nr 800 in this thread, let's make it 1K

Congratulations, great work Bashir and all the other guys who came op with addons.
It means that this method has something valuable...:cheesy:
 
Hi Bashir,

While waiting for a pullback to the 15ema on the 1min chart sometimes it doesn't pullback all the way to the 15ema and you miss the trade. I know you can use the 89tick chart 15ema but you need to wait for the 1min stochastic to be up (at least for part 1 of the trade setup).

Can you use the 15ema on the 89tick chart without the 1min stochastic being on your side for part 2 of the trade (the pullback to the 15ema on the 1min chart) so that you don't miss the move?
 
Top