Moneylender
Legendary member
- Messages
- 5,693
- Likes
- 369
A great run from 1986..dont want to push my luck
Been a good day, well done everyone
A great run from 1986..dont want to push my luck
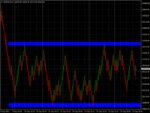
Panning out, here's a 20pt Renko chart ('coz there ain't nearly enough of 'em on this thread, lol!). Vertical dashed lines are daily markers . . .The 7.00pm candle sets the high/low, r/s for a while me thinks . . .


into our 10068 area
now what ??
no real sign of any bulls as yet

price moved away from the red trendlineWon't be many bulls out today especially after yest sell off.

