esignal charts

breadman

Established member
Messages
526
Likes
25
I am new to esignal and require a bit of help with some teething problems.

i have posted the problems on esignal central however they haven't come with the right fixes

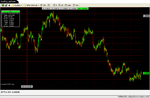
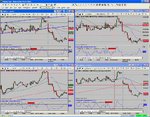
i can't seem to get all the data available on my advanced charts to compress into one screen. the only way i can see some of the historical data is to click and drag.!!
can anyone assist with the actions i need to take to correct this.

second and last problem is with creating a relative chart or i believe it is also known as a ratio chart......I.E how a share is performing against its index e.t.c.
i have being unable to find the actions to create it

your help will be much appreciated
b
 
Are you viewing your charts in a page or a layout

Can you post a chart example and tell me what is missing from it ie what more you would like to see on the chart and I will try and help
 
roguetrader said:
Are you viewing your charts in a page or a layout

Can you post a chart example and tell me what is missing from it ie what more you would like to see on the chart and I will try and help

thankyou for answering, i have attached an image of a currency. this is all the data i can view on my screen at once.
to view the rest i have to click and drag, i will then lose the data i was just looking at.

hope the screen shot helps
B
 

Attachments

  • snapshot-1.png
    snapshot-1.png
    72.3 KB · Views: 3,086
breadman said:
thankyou for answering, i have attached an image of a currency. this is all the data i can view on my screen at once.
to view the rest i have to click and drag, i will then lose the data i was just looking at.

hope the screen shot helps
B
just to clarify ............ i have a chart with 10 years of data, i only know this from click and dragging, i want to view all the 10 years at once, not two years at a time by clicking and dragging
 
On the advanced toolbar repeatedly click the decrease bar spacing (like 2 arrows pointing at each other) this will compress the data into one frame and should compress all the data you have. My only reservation looking at your chart it looks as if you have done this already
 

Attachments

  • screenshot.JPG
    screenshot.JPG
    309.7 KB · Views: 2,731
roguetrader said:
On the advanced toolbar repeatedly click the decrease bar spacing (like 2 arrows pointing at each other) this will compress the data into one frame and should compress all the data you have. My only reservation looking at your chart it looks as if you have done this already

afraid i have rouge trader......... still wont allow me to look at all the data,

whats weird is you can look at all the data in a standard chart by using the chart properties button. just enter the amount of days and up it pops,
advanced chart doesn't give you that option much to my amazement!!! i take it their is nothing else i can do,

thanks for your help
 
breadman have you tried increasing your intervals to weekly or monthly,that way you should get all your data on one screen.
 
Top