You are using an out of date browser. It may not display this or other websites correctly.
You should upgrade or use an alternative browser.
You should upgrade or use an alternative browser.
tradesmart
Experienced member
- Messages
- 1,286
- Likes
- 22
When stocks are standing on their heads, doing somersaults at the re-election of a President who has taken the country into a bloody war on false pretences/the release of distorted employment data/high oil prices and in the face of rising interest rates and fading corporate profits; not to mention the twin deficits forcing the dollar to all time lows against competitors, one begins to smell a rat….
However, if investors are expecting the market to rise and are putting their money in, up the markets will go…… :cheesy:
But some profit taking setting in today, so maybe we will backtest the top former resistance trendline from the February high as support (at the very least…) but fib retracement levels from the recent two week 700 point run up may come into play.....(sometime..) and is that a bear triangle I see.....?
The recent dramatic bullishness may be keeping us guessing (again..!) at the possibilities to relate the price moves to identifiable chart geometry….
One possibility is a likely bump and run setup – at least the ‘run’ must come fairly shortly after such a steep, probably unsustainable rise.
On the 4hr chart it’s quite easy to ‘humour’ parallel lines into some semblance of a channel, but we need some kind of pullback now to confirm this…..
It’s always good to get some humour into the situation…… 😉
On that note, when all the research, technical analysis and soul searching is done and you decide to pull the trigger on a trade; there really is only one question to ask yourself……
Do I feel lucky…..?
Well, do ya Punk ……??
Attachments

Last edited:
frugi
1
- Messages
- 1,843
- Likes
- 133
Bill
Active member
- Messages
- 160
- Likes
- 1
Did it Make my day?
Well..... Would you Adam & Eve it? Yet another nil poin day. Don't get me wrong, good day for the channel rules but I was not home till after 5:00pm so missed the best opportunities. Have a look at the charts. Took one short at 7:00pm, rolled the SL to BE when it went into profit and got stopped. C'est la vie. as Del Trotter would say.
Bill ( or should that be Nill ? ) 🙂
+-15 ema Rules are
1. Short if price crosses 100ema and touches/crosses 100ema+15.
2. Long if price crosses 100ema and touches 100ema-15.
3. Short if nd and price is 100ema +15 [or v close]
4. Long if pd and price is 100ema -15 [or v close]
5. Don't trade in the 1st hour
6. Stop losses above/below obvious SR
7. Don't open a trade in the last hour
Attachments
I'd say Nil was a good result for today. I remember the good ol whipsaw days like these that cost a packet... Bump and Run Reversal looks to be possible, but has joe public been conned to O/B or does the market want the same again, Sam?
There's enough in that triangle to go to 450 and more than enough room in RSI and CCI.
In the end, it will go where the market wants. Not where you or I would think, would like - or hope.
There's enough in that triangle to go to 450 and more than enough room in RSI and CCI.
In the end, it will go where the market wants. Not where you or I would think, would like - or hope.
Attachments
A typical nightmare whipsaw day. Just take the time to pick a position and toss a coin for long or short and then apply the 100MA rules to see if you can save your Butt..... I know Bill didn't have a full day at it, but as I said above, to come out evens is no mean feat. There were a couple of places where you could have come out on the right side, but that required clarity of vision. Not easy if your previous couple of trades have bombed out....
Attachments
wasp
Legendary member
- Messages
- 5,107
- Likes
- 880
there was me thinking it was just me!
took a risky gamble from a double bottom on the yahoo charts I still watch at times which paid off with 5 points just after 11 and then took a few points loss on the up just before 7pm. ended up okay yet unexciting.
heres hoping for something better tomorrow...
Chris
took a risky gamble from a double bottom on the yahoo charts I still watch at times which paid off with 5 points just after 11 and then took a few points loss on the up just before 7pm. ended up okay yet unexciting.
heres hoping for something better tomorrow...
Chris
roguetrader
Senior member
- Messages
- 2,062
- Likes
- 49
A day of chop, a day to rest the trigger finger, sit back and wait for mrs market to show her hand
TraderTony
Active member
- Messages
- 180
- Likes
- 1
Monday 8th November 2004
Carries on from Friday in same tight range. After over trading on Friday I decide to take no trades until the MACD line gets to at least +5 or -5 (orange lines on my indicator chart) as this seems to be a reasonable filter of flat or choppy action.
Well, by 2pm it still hasn't broken out although there is now some possible upside action and MACD is testing the orange line for the first time in the day.
14:20 Breaks up to HOD at 10400 then spikes straight back down. Ugly bar. Also possible ND on RSI, CCI and MACD.
15:00 One hour to go and a 46 point range so far. 10400 touched twice as HOD. MACD line never above 5 so far.
15:15 Well, I'm going to throw in the towel there. Only the second day ever I have not taken a single trade but I'm pretty pleased with that as it's a significant improvement to losing on Friday when I took too many trades in a flat market.
0 from 0.
Attachments
Well guys, I took one trade only , worked short and sweet 16 points. Only one more trade @ 10401 a sell left over as I am bear and have been a bear since Friday,the reason being there is a gap left open since the 5/11 on the open @ 101317 on the one minute charts, which needs to be filled ..well we all know what happens to gaps ...eventually. Please check out my 10 min triangle a bit different to CM's also note a the two bearish engulfing patterns in the last hour or so...
Let's see how it goes, best of luck for everyone's who on board. :cheesy:
Let's see how it goes, best of luck for everyone's who on board. :cheesy:
Attachments
Quercus
There you go, I have edited.
Is it because I made money, There is nothing said when others on this thread post they trades up,dont you believe me. I done live trades here before, I don't need to prove nothing, I will not reply to you again.
My traders for today. for the firts and last time.
Account : xxxxxxxxx
Order ID Bought Sold Fill price* P/L Cumulative P/L
YMZ4
51363630 * S1 10,393.0000 * *
51364036 * S4 10,415.0000 * *
51364228 L5 * 10,412.0000 -35.00 -35.00
51364036 * S1 10,415.0000 * *
51364238 L1 * 10,411.0000 20.00 -15.00
51364273 L10 * 10,409.0000 * *
51364308 * S10 10,412.0000 150.00 135.00
51364402 * S10 10,421.0000 * *
51364423 * S10 10,417.0000 * *
51364752 L20 * 10,419.0000 0.00 135.00
51364723 * S10 10,424.0000 * *
51364796 L10 * 10,414.0000 500.00 635.00
51370763 L1 * 10,376.0000 * *
51371502 * S1 10,380.0000 20.00 655.00
51370763 L3 * 10,376.0000 * *
51371533 * S3 10,380.0000 60.00 715.00
51370763L 1 * 10,376.0000 * *
51371734 L3 * 10,370.0000 * *
51371869 L3 * 10,370.0000 * *
51371932 * S7 10,375.0000 145.00 860.00
51371991 * S10 10,375.0000 * *
51372020 * S10 10,373.0000 * *
51372033L 20 * 10,374.0000 0.00 860.00
51372110 L5 * 10,376.0000 * *
51372147 * S5 10,380.0000 100.00 960.00
51372190 * S10 10,378.0000 * *
51372194 L10 * 10,374.0000 200.00 1,160.00
$1.160.00 for the day - comis $390
CJ
somtimes little acorns fail to grow!
frugi
1
- Messages
- 1,843
- Likes
- 133
Come on little ES triangle, resolve thyself so we can jump upon your coat tails for a cornucopia of points. Three touches on the top, two on the bottom - decision time tomorrow I suspect. Note the fresh air around the top touches: those bears really beat the bulls back twice today. In fact the Dow failed to touch the top of its channel for a third time at all (clearer on 5 min chart, not shown). A sign of weakness amongst the bellwethers?
The thought of heavy historical resistance at 1173-76 on the daily SPX chart seems to be keeping the bulls suppressed for the moment, and of course we all know that only the S&P has broken out to new highs (set in Jan/Feb), while the Dow and Naz lag significantly. Bifurcation does not a healthy trend continuation breed, usually. Meanwhile the 1163 BO level is scaring the bears with its sports bra level of support. If that goes I smell a large pullback.
However wouldn't it be fun to break out up tomorrow with eager bulls expecting at least a 10 point SPX run (about 90 Dow pts) up only for it to reverse around 1173-6 and tank? That would mess up a lot of positions to the market's great satisfaction; with all the shorts burned who's left to provide a bid if/when she tanks. Anyway, I won't be buying an upside BO given this stiff res, failure of indices to confirm together, the NDs that haunt the hourlies, the fact we've had 9 up days in a row and virtually no pullback, the potential 2Bs on the Naz/Dow hourlies (Naz BO to 2050 and immediately pulled back below 2047 res - as Buk will tell you half primes matter) indeed even the sluggish dailies are beginning to look OB. Yes I know, if there's enough fuel the market cares not a jot for oscillators but I'd prefer to let it do its ting then short from a higher level (or a downside tri break of course) then/or buy a decent pullback.
I still say down for the rest of the week to grab a breath of fresh bovine air before a decent Xmas rally ensues, but who cares for predictions except those selling them?
Attachments
Last edited:
Bill
Active member
- Messages
- 160
- Likes
- 1
How's this for coherent gibberish?
Chart for today attached with a little more success. Was not home early enough to take the long entries but I did have a bash a the two shorts [7pm & 7:15]. I don't want to bore you with too much detail as I'm working on a modified plan of attack. [If it works I'll post it but it's a bit more complicated than I would like]. The first short was closed for BE but the second closed at 8:45pm for +25. Now that's better innit !
In case anyone was wondering about stops. They are 30 +5 for the spread. The new approach will still put me on the wrong side of the market if it trends so I'm far from happy with it yet.
Regards
Bill 🙂
PS Not trading for the rest of the week as the in-laws are coming to stay 😢 . Might have to do some overtime.
Attachments
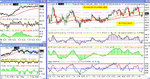
All the time the RSI channel drifts down, the bigger the probability for a break to the upside becomes. From a balanced point of view, thr two channel lines should provide a clear cut decision on direction.Is it a triple top at 420 and so down is the only way? You can usually get a clue for a channel breakout (flag) by the last cycle failing to make support or resistance.Will we see that here?Is the closing dip to 384 a failure to make support? More questions thatn answers. :cheesy:
Sall. Your triangle is good. We all see something slightly differently ( or not at all) and there is nothing to say that either you or I are right, or we are both wrong. The important thing is to plan what you are going to do based on what you see.If you don't plan ( even if your plan is flawed), you're doomed.
Sall. Your triangle is good. We all see something slightly differently ( or not at all) and there is nothing to say that either you or I are right, or we are both wrong. The important thing is to plan what you are going to do based on what you see.If you don't plan ( even if your plan is flawed), you're doomed.
Attachments
Hard day, but some decent targets to work with, if you got the correct entry. I respect everyone's posts here but I'd like to ask Bill to consider his allocation of 30 points +5 ( for the spread) as a stop. As a general guide, we know from experience that the normal extremes of pullbacks is 20 points, except for very strong moves where you can expect 30 points. My personal opinion is that at 30, it's a potential extra loss of 10 points. I'm not criticising, just curious as to why more than anything. And I appreciate that we all have to use what we are comfortable with.
Attachments
Similar threads
- Replies
- 0
- Views
- 1K
- Replies
- 0
- Views
- 2K
- Replies
- 10
- Views
- 6K