You are using an out of date browser. It may not display this or other websites correctly.
You should upgrade or use an alternative browser.
You should upgrade or use an alternative browser.
This is just for my reference. Will sort them out later.
http://www.trade2win.com/boards/showthread.php?p=252227#post252227
http://www.trade2win.com/boards/showthread.php?p=252227#post252227
Chorlton said:Once again, thanks for the reply & I apologise if my questions are a little basic 😱
With regard to RSI, can I ask what levels constitute a buy and sell for you. Do you use the standard 30 & 70 levels??
I ask because from memory I have noticed a number of stock charts that due to their constant upward (or downward trend) have the RSI either in the overbought or oversold areas for a great amount of time. Even when the stock undergoes a pullback the RSI can still maintain at a level either above the 70 or below the 30 levels.
Unfortunately, as I'm not at home I am unable to check my charts and confirm which stocks these are.
Consequently, in these cases I have found the use of RSI to not be very effective but obviously I would welcome any advice on how I can make better use of this indicator.
btw I hope your trading is also going well...........
Chorlton
I'd go further. I don't think that any indicator based on averages is any better than using an average itself , and averages are simpler to construct. I believe that it is all there, in the plain bar, or candle, chart. The fact that I can be as blind as a bat doesn't change it 😕 A medium average to give an idea of how the trend is going, is all I use, but I am going thrugh a unsuccessful period at present- good job that I seem to be OK on keeping losses under control. The trouble with bad patches, as far as I am concerned, is that I am inclined to try new methods- a waste of time, in my view.
What do you think of an MACD signal, used in conjunction with pullbacks? If averages rise, buy on pullback. If average falls, sell on pullbacks?
Split
Attachments
Chorlton
Established member
- Messages
- 693
- Likes
- 48
Splitlink said:I'd go further. I don't think that any indicator based on averages is any better than using an average itself , and averages are simpler to construct. I believe that it is all there, in the plain bar, or candle, chart. The fact that I can be as blind as a bat doesn't change it 😕 A medium average to give an idea of how the trend is going, is all I use, but I am going thrugh a unsuccessful period at present- good job that I seem to be OK on keeping losses under control. The trouble with bad patches, as far as I am concerned, is that I am inclined to try new methods- a waste of time, in my view.
What do you think of an MACD signal, used in conjunction with pullbacks? If averages rise, buy on pullback. If average falls, sell on pullbacks?
Split
Hi,
Not sure if the question was directed at me Split but I shall answer it anyway.
To begin with I'm learning all the time myself so what I post here may not be correct but its what I've experienced. Also, I just want to clarify my trading strategy / style as this may have some influence on my answer.
With the exception of buying stocks which I purchase after detailed research and then apply the "buy & hold" strategy holding them for the medium to long-term, the remaining part of my trading is via Spread Betting. I got into SBetting as a bit of fun but after a little while realised that by placing so many trades on a regular basis and more importantly monitoring them, I feel that my overall understanding on how the Stock Market works has improved.
With regard to Sbetting, I swing trade and hold positions open from anything from between 3 days to 3 weeks - maybe longer if the trend is looking good & I'm making a nice profit!!! 🙂
Personally, I have never really got to grips with the MACD. I understand what it is and how it works but never spent long enough with it to see whether it is effective (for me). I do use something similar and that is Chick Goslins indicators. The reason for this choice is that I read the book, loved his approach and as I trade only bullish / bearish stocks (which are in an established trend) find that his methodology suitable. However, I only use his indicators when looking for an exit as I find that for entry his indicators are not that effective. Again IMO.
For Entry, I try to keep things simple. I look for pullbacks and monitor VOLUME very carefully. I think the relationship between price & volume is crucial and that trading price alone is like only knowing "half the story", again IMO.
Recently I have been looking for some more visual way of showing the relationship between price & volume and consequently have started to use the Accumulation / Distribution line. I prefer it to say OBV as it takes into account where the close is compared to the high & low for that particular day. I read a book on VSA a year or so ago which also commented on the important of this relationship.
Interestingly, I am still looking for another indicator to help me with entry for confirmation and was hoping that maybe the RSI could be used. But as I wrote in an earlier post, it doesn't seem that effective in trending markets.
All the best,
Chorlton
Hi Chorlton,
I was pondering the posts between Hung and yourself on the use of RSI.. Just expressing my own ideas on trade selection. Never have been much good with volume so have to use other methods. I, too, am mainly in share portfolios.
Good trading
Split
I was pondering the posts between Hung and yourself on the use of RSI.. Just expressing my own ideas on trade selection. Never have been much good with volume so have to use other methods. I, too, am mainly in share portfolios.
Good trading
Split
barjon
Legendary member
- Messages
- 10,752
- Likes
- 1,863
mmm, just to add my twopennorth.
I wouldn't use rsi as a primary indicator for entry/exit myself. If I used it (I don't), I'd see it in the background on the basis that, at extreme levels, the chances of at least a pause in the price movement increases.
So far as volume is concerned I've tested it every which way (relative volume on signal bar, leading up to signal bar, on entry bar etc etc) and I have yet to find that it makes a significant difference to results of the method I use. That may well be because I can't get to grips with the price/volume dynamic, but there you are.
good trading
jon
Jon, Split and Chorlton,
What a good discussion! And I agree with what you said. I haven't found any golden indicator and am not using any indicator for triggering trades. They're there as additional sensors.
At the moment, I am working on my exit strategy. I was just stopped out of EMG this morning and though I made 80 points, I could have made 160. I'll see if it's a good idea to trail my stop that soon.
Good trading,
Hung
And just to add to it what we use are influenced by what we read and which seminars/workshops we've been too. Had I not been to Chris Manning's workshop, I would not have used MA and RSI. There're thousands of indicators out there and it's just a matter of familiarity and personal preferences that determine which one we use.
Chorlton
Established member
- Messages
- 693
- Likes
- 48
hungvir said:Jon, Split and Chorlton,
What a good discussion! And I agree with what you said. I haven't found any golden indicator and am not using any indicator for triggering trades. They're there as additional sensors.
At the moment, I am working on my exit strategy. I was just stopped out of EMG this morning and though I made 80 points, I could have made 160. I'll see if it's a good idea to trail my stop that soon.
Good trading,
Hung
Hi All,
I agree with your point Hung about only using indicators as additional sensors and not to primarily signal a trade.
Personally, I do not think it is feasible to create a 100% mechanical system for trading stocks, even though when I first started out trading I thought it was possible.
In my previous post when I mentioned about monitoring volume, what I'm actually interested in is "changes" to volume compared to the average volume for that period. ie. Low volume or volume spikes.
These changes in volume when read together with the price action for that day can quite often offer some clues as to whats going on in that stock.
I do think that to make consistant profits one has to clearly understand whats going on in the market at any one time and hence why I think that volume is just as important as price when assessing the situation.
One good example which I have seen a number of times is when a SP (after trending upwards) over many days suddenly gaps up but on low volume. A lot of people (including myself in the past) could see this as a good opportunity and buy in hoping that some news has been released, etc , etc and that the SP will go higher.However, in reality the next 1-2 days the SP drops back down lower than before it gapped up, trapping those investors in at the higher price.
In my strategy when I look for pullbacks, I also keep an eye on the volume. If the volume starts to fall as the pullback happens (compared to the average volume before the pullback took place), then this is a good buying signal for me. If, on the other hand, the volume rises then I would wait and see where the SP levels off to before placing a trade.
All IMO,
Good Luck to all & thanks for the good discussion.....
Chorlton
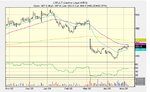
This is the piece of news that dragged EMG down today. It took me by surprise as I think it's one of the best shares to have at the moment. Will have a look at the chart and long it again tomorrow.
http://www.advfn.com/p.php?pid=nmona&cb=1147202222&article=15341083&symbol=LSE:EMG
http://www.advfn.com/p.php?pid=nmona&cb=1147202222&article=15341083&symbol=LSE:EMG
Chorlton
Established member
- Messages
- 693
- Likes
- 48
hungvir said:This is the piece of news that dragged EMG down today. It took me by surprise as I think it's one of the best shares to have at the moment. Will have a look at the chart and long it again tomorrow.
http://www.advfn.com/p.php?pid=nmona&cb=1147202222&article=15341083&symbol=LSE:EMG
Hung,
For your info, UBS recommends Man Group as a BUY today, with a target of £32
Regard,
Chorlton
Chorlton said:Hung,
For your info, UBS recommends Man Group as a BUY today, with a target of £32
Regard,
Chorlton
Thanks, Chorlton! I appreciate it. From the chart I also saw enough strength for it to go all the way to at least 30.
Best,
Hung
Chorlton
Established member
- Messages
- 693
- Likes
- 48
hungvir said:Thanks, Chorlton! I appreciate it. From the chart I also saw enough strength for it to go all the way to at least 30.
Best,
Hung
Hung,
Can you explain how the chart shows strength up to £30???? Just interested buddy 😀
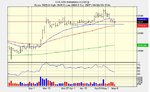
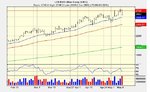
EMG stood at around 2200 in early March. It's has now touched 2750. Assuming no change in trend, another 250 point rise is not too wild a dream 🙂
Anyway, I already put in a stop buy order for it. If it can rise above yesterday's high, I'll be in the game again.
Good trading,
Hung
Anyway, I already put in a stop buy order for it. If it can rise above yesterday's high, I'll be in the game again.
Good trading,
Hung
Attachments
Chorlton
Established member
- Messages
- 693
- Likes
- 48
hungvir said:EMG stood at around 2200 in early March. It's has now touched 2750. Assuming no change in trend, another 250 point rise is not too wild a dream 🙂
Anyway, I already put in a stop buy order for it. If it can rise above yesterday's high, I'll be in the game again.
Good trading,
Hung
Hung,
Thanks for the quick reply!!! Interestingly, I also use Finspreads !!!
I also struggle to determine future SP's levels especially when they are currently at new highs. But I understand your reasoning for the £30 target 😉
Volume today is high (compared to the 30day average) plus we have a close near the low. Also, the SP has "relatively" good upward support which assuming that the price continues downwards tomorrow would suggest a reversal at around 2570 - 2585.
However, with the news today, not sure what will happen. I'm off work tomorrow so will keep a watchful eye on this.
Once again thanks for the post. I think I will be able to learn a lot from this friendly bb :cheesy:
All the best,
Chorlton
interesting thread
btw,used to live in swindon..chapel street last year..hows the town keeping up?
went long AZN yesterday as im seeing some sector rotation coming up.Wished i'd shorted mining and banks but we all know how the game is rigged to the upside for the time being
btw,used to live in swindon..chapel street last year..hows the town keeping up?
went long AZN yesterday as im seeing some sector rotation coming up.Wished i'd shorted mining and banks but we all know how the game is rigged to the upside for the time being
Similar threads
- Replies
- 7
- Views
- 8K
- Replies
- 20
- Views
- 12K