Current Spreads Journal

Hi BB -

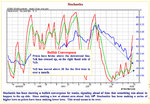
I can view this chart easy enough butam not able to access past years charts to decide whether the current level is historically high.

Was this trade suggested by JR? MRCI?

Is your trading style concerned more with trading against short term extreme price movements rather than with expected seasonal movements? I have thinking a lot about this myself over the past few days using the charts from MRCI which show the spread distribution in each of the last 15 years.

Thanks

FN
 
fading or trend trading a spread

Hi Fastnet

Spread doesnt look expensive versus a 50 day moving average at the moment actually. Looks expensive over the long term on the chart, but if you are looking for profit shortly dont think this is one to go for.

Yeah, I think its great to trade against an overbought movement, but then I trade bond futures normally and I think this works for those contracts, whereas I know little or nothing about commodities. But this is a spread and a spread should revert to the mean? Should really back test ideas like this to see how often it reverts to its mean versus how often it moves further away given a particular entry point like 10% above or below moving average.

See the attached excel files for results. I calcd 2 ratios, s-2*c and s-3.5*c, which has lower variance. I then took the moving average away from the variance and looked at whether the spread was overbought oversold, at the moment it looks like its too close to the average/fair value. But back on June22 with Soybeans around 750usd, spread was trading at-104 and now its -135...going short you could have picked up 31usd on the spread, 3000ticks!!

Looking into a sensible trading system on this and will post results shortly.
 

Attachments

  • 050701.xls
    787.5 KB · Views: 283
Current Spreads - July

Looking at the following spread:

Buy Dec 05 Live Cattle / Sell Dec 05 Lean Hogs on the CME.

MRCI recommend buying into this spread during the first week of July and holding for just a fortnight.

This years chart has hugged the 15 year chart pretty well so far this year. Price is currently off its recent highs. I'd look to enter on a break of 32 with a target of 40 and stop of 28.

If you made a loss on this spread w/i the fortnight it might be best to leave the trade open and forget about it until mid-August. This has been the first of the two annual market peaks both in the past 15 years but especially in the past 5 years. If, by mid-August, you are still sitting on a loss you could hold on for the second of two annual market peaks in late Oct. The beauty of far out contracts I suppose.

Following this strategy might be fairly psychologically demanding since there is a seasonal trough between these peaks in late September which would I'm sure shake out the faint hearted or thinly margined.

$400 per whole point move - not sure about the margin but I think it will be reduced due to both being CME contracts.

Anyone any thoughts about this trade. I like the idea of having a second chance should the trade not show a profit by the third week in July.

Regards,

FN
 
General Question

Replying to my own thread is a bit sad :eek: However, I have a general question for the more experienced spread traders out there.

The MRCI charts always pick a certain period of time for their recommendations. This period can last from a week to maybe 6.

However when you look at the chart for whole year through the period under consideration (yellow highlight) does not always seem to be the most obvious period to go for. There are often steeper rallies in the 15 year and 5 year charts which coincide with annual peaks and troughs.

I just wondered how and why MRCI chose the period they do. I am assuming that each spread only comes up once a year. I've not been watching long enough to find out whether MRCI recommend the same spreads each year or even whether they recommend the same period within each spread each year. is this making any sense?

For example: take the Live Cattle - Lean Hogg spread discussed above:

The period chosen by MRCI (middle two weeks of July) is a period of consistent rally in the spread. However so is early to late October. Or what about selling LH and buying LC (opposite spread) at mid- August to end Sept? or even buy LC sell LH any time in late April/early May for the steady rise into mid August?

Each of these periods appears to show likely moves.

I am wondering whether MRCI have generated software that can analyse the spread charts for each of the past 15 years. The period under consideration is then that with the closest correlation over each of these 15 years?

Does anyone know whether this is the case?

Does anyone know where you can find historic spread charts for individual years? Britefutures and Futuresource don't do them.

Thanks and regards,

FN
 
soybean corn results

Looking at this spread, trading in with one clip not scaling and fading the spread with no money management, simply getting out when the spread crosses its moving average, optimal results are a daily moving average of around 30 days, trading at about 20usd from the average.

Over about 950 days (from start2002) there are 36 trades made, making 340usd with a daily standard deviation in pl of 8usd. Max drawdown is around 140usd.

Yeah trading is easy!
 
TOMORROW'S TRADE

Buy March 06 Corn Sell Dec 05 Corn. CH6 - CZ5

Close on Friday 243.75 - 235.75 = +8

This is a long term but (fingers crossed) reliable trade. Looking for +18 by September/October. 15 year chart shows that we should already be at +12 so this trade is already late but seems now, finally, to be stirring into life.

Stop at +5.

Anyone any thoughts?

FN
 
fastnet said:
Does anyone know where you can find historic spread charts for individual years? Britefutures and Futuresource don't do them.

Hi! Look into the attachements if I can manage it to show up ;)

www.barchart.com - $20 per month - free 30 day trial
www.trackntrade.com - depends what you need - free 30 day trial

Greetings
Tom
 

Attachments

  • spread_1987.gif
    spread_1987.gif
    18.9 KB · Views: 267
  • spread_1989.gif
    spread_1989.gif
    16 KB · Views: 242
Hi,

I use www.scarrtrading.com The software allows you to pick individual years of spreads, and there are a lot of other great tools.

Not affiliated with them--just a satisfied customer.

E

fastnet said:
Replying to my own thread is a bit sad :eek: However, I have a general question for the more experienced spread traders out there.

The MRCI charts always pick a certain period of time for their recommendations. This period can last from a week to maybe 6.

However when you look at the chart for whole year through the period under consideration (yellow highlight) does not always seem to be the most obvious period to go for. There are often steeper rallies in the 15 year and 5 year charts which coincide with annual peaks and troughs.

I just wondered how and why MRCI chose the period they do. I am assuming that each spread only comes up once a year. I've not been watching long enough to find out whether MRCI recommend the same spreads each year or even whether they recommend the same period within each spread each year. is this making any sense?

For example: take the Live Cattle - Lean Hogg spread discussed above:

The period chosen by MRCI (middle two weeks of July) is a period of consistent rally in the spread. However so is early to late October. Or what about selling LH and buying LC (opposite spread) at mid- August to end Sept? or even buy LC sell LH any time in late April/early May for the steady rise into mid August?

Each of these periods appears to show likely moves.

I am wondering whether MRCI have generated software that can analyse the spread charts for each of the past 15 years. The period under consideration is then that with the closest correlation over each of these 15 years?

Does anyone know whether this is the case?

Does anyone know where you can find historic spread charts for individual years? Britefutures and Futuresource don't do them.

Thanks and regards,

FN
 
fastnet said:
TOMORROW'S TRADE

Buy March 06 Corn Sell Dec 05 Corn. CH6 - CZ5

Close on Friday 243.75 - 235.75 = +8

This is a long term but (fingers crossed) reliable trade. Looking for +18 by September/October. 15 year chart shows that we should already be at +12 so this trade is already late but seems now, finally, to be stirring into life.

Stop at +5.

Anyone any thoughts?

FN

Went off for a long weekend and arrived back Tuesday morning to find that this trade had totally collapsed thru my stop loss to +3.5

Left yesterday and it recovered some ground to +5.5 - above my original stop. Not sure what to do. Plan was to get out if this happens but. . .
 
fastnet said:
Now at -7.75 - if there's a little more movement in the right direction this pm considering adding next brick to the pyramid. Strictly just one at a time.

Anyone else watching the spread? Any advice/comment? Always welcome.

Regards,

FN

This trade is still going okay - now at -5.5.
 
Charts looking good FN, I like the narrowing parrallel Bollinger bands and orderly higher highs and higher lows.

era
 
This trade has now recovered to +7. Still slightly in a loss (got in at +8) Now very nervous about holding on but will do so for the time being.

I wonder if any of the more experienced traders can comment in such erratic dips and recoveries in spreads? I imagine this could be caused by some shock event in the near term leg which quickly stabilises?
 
This trade has now bombed and is sitting at -9.2.

Not sure whether to get out? I'll see what happens today.
 
This trade still limping along. Chart now look awful.

Peaked Wed at 7.4 , now back at 7. I'm still in a slight loss posn and, again, wondering what to do.

These are supposed to be long term, reduced risk trades but the volatility is crazy.

FN
 
Current Spreads - August

Placed following crude spread MOO basis yesterday:
Buy Dec 05 Crude Sell June 06 Crude
CLZ5-CLM6

In at 0.25.

$10 per cent move.

Stop at -0.5

First target 1.00

Basis - seasonal.

Closed at 0.46 yesterday.
 
Also placed a Eurodollar spread - again on a seasonal basis. Buy Dec sell Sept 05.

Buy EDZ5 sell EDU5

Filled at -0.31. Mental stop at -0.36

Initial target - 0.1.

Basis seasonal - bit of a falling knife scenario so short stop and keeping a close eye on it. Margin required is low. I'd like to see real strength return (at least initial target) within the next fortnight or else I'm out.

Regards,

FN
 
Time is on your side

Hybrid Thread

You can trade seasonals long-term. It takes time for them to develop. Euro$ also trend for long periods in the same direction, until they turn like they are doing here.

fastnet said:
Margin required is low. I'd like to see real strength return (at least initial target) within the next fortnight or else I'm out.
 

Attachments

  • dec:sept.jpg
    dec:sept.jpg
    422.1 KB · Views: 285
Yesterday opened following Wheat spread

KWZ05-KWN06 ie Kansas Board of Trade should have been filled at -7

However due to a miscommunication with my broker I ended up with a Wheat spread in Chicago of -23. WZ5-WN6

This mistake was made despite emailing the order to my broker. I followed my email with a phone call to double check.

Moral of the story is to ignore the clipped, self-important and hurried tones of these order clerks. EMAIL orders (as GT has reminded us several times) and if I must speak to them make sure they repeat the order in MY terms not theirs. (they have their own lingo for certain contracts/months). I can't help wonder why we need these intermediaries any more. I'm sure they provide a useful function to certain market participants. However, those trading spreads on an EOD basis certainly don't need orders to pass through an infallible human being. Sounds cold I know but it's true.

Rant over. I'm going to take up my case with the broker in an hour or so . . . . Not a big trade in this case (just one contract) but that's hardly the point!

FN
 
Last edited:
Current Spreads October

After my crude spread disaster last month (wiped out all winnings from July/August) my only current open position is a lean Hog spread (described in September traders thread). This trade is looking okay but needs a few weeks yet to develop properly.

I am now looking at two soya derivative spreads. One was recommended by Joe Ross in his latest bulletin:

It's a December/July soybean oil spread BOZ5 - BON6. Here's what Joe had to say:

QUOTE

The spread has been following its seasonal pattern nicely so far, and is now ready to move up. Traders may want to enter the spread at a value of –0.51. Margin for the spread is $101 (reduced margin). Suggested risk is $200. Suggested initial stop is at –0.76. Initial projected objective is $200, then a move to 0.60. Basis is seasonal and a 1-2-3 low.

UNQUOTE

I like the look of this spread but will choose between this and a Dec - July soybean meal spread SMZ5- SMN6. The window for this trade is essentially the entire month of October closing on the 2nd Nov. It ''should'' bottom out over the next few days after a long decent into its seasonal bottom. Current at a spread of -10. Looking for 0 as first target then 10-15 as a final target.

Anyone any thoughts?

Regards,

FN
 
Hi Fastnet

I currently have a long on Soyabean Oil (opened 7th Sept) which after some floundering is starting to do quite nicely.
As far as the other Soya commodities are concerned I don't know, but the following is from a report posted on the FullerMoney website and may be of interest to you.

"As the soybean harvest in the U.S. approaches 50%, it is becoming increasingly apparent that a breakthrough in yield technology is taking place. In the important states such as Iowa, Nebraska, and Minn., which enjoyed favourable weather this growing season, the yields are coming in far above expectations, and in most cases 5 to 15 % above the previous records. But what is so shocking is that in states such as Illinois, where conditions were anything but good, yields are above average, and in some cases above a year ago. Some areas of west central Illinois received between 5 and 6 inches of rain from June 1 to Sep 15 (35 to45% of normal) with above normal temps., and yet yields are averaging between 45 and 65 bushels per acre, which is pretty much on par with last year's record. Even in Michigan, which received 25 to 50 % of normal precip. in the most crucial pod filling stage, we are hearing of record yields!

"The national soybean record was achieved last year at 42.2.In Aug of this year, the USDA projected a yield of 38.7, and in Sep,39.6,which seemed high, considering the unfavourable weather during pod fill for so many areas. Next week the USDA will give us their Oct. estimate, probably a 42 type number, but unless the later yields collapse, the final Jan yield will easily be over 43 and an all time record, which seems impossible given the weather. What does this mean? Firstly, current carry out estimates of 150 to 200 million bushels will grow to 400 to 500 million, which is extremely burdensome. Secondly, the trend line yield next year will have to be 43+,assuming normal weather. Added to this, there will be a large increase in bean acres, as farmers will switch from high energy consuming corn to low energy consuming beans. There are many other factors that will decide the price over the coming months (biodiesel for one), but one thing is for sure, far fewer traders will be watching the Weather channel next summer! FYG my yield data come from well over a thousand reports, some anecdotal, but many from seed companies' variety trials."

Regards

Peter
 
Top