the dj-30 is the us30!
Many thanks.
the dj-30 is the us30!
no worries bud...Many thanks.
Hello NVP,
Just 2 or 3 questions please:
1. Is the free FXCorrelator indicator on your blog Free FXCorrelator Indicator & Video |FXCORRELATOR, the most up-to-date?
YES
2. For your 80/20 system, which time frame(s) do you use?
any ....but safely 15m TF upwards is best
3. Would the DJ-30 be the same thing as the US30 (DOW) you use? I can't seem to get this - US30 - on the MT4 platform I am using, so was going to use the free charts on FreeStockCharts.com, but can't get the US30 either, but got amongst others the DJ-30, which prices seem similar to the US30 in your examples.
YES - use them
Many thanks
Dan
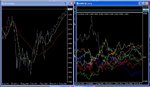
Hey Gang
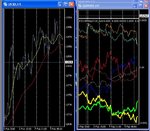
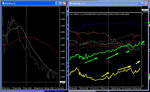
As ive just briefed my VIP Crew......That Dow is under big big Pressure today after some gains in the week
just gotta be hunting buys on the yen and usd ?
(yellow and Green lines on the right chart) 😏
N
1. Is the free FXCorrelator indicator on your blog Free FXCorrelator Indicator & Video |FXCORRELATOR, the most up-to-date?
YES
2. For your 80/20 system, which time frame(s) do you use?
any ....but safely 15m TF upwards is best
3. Would the DJ-30 be the same thing as the US30 (DOW) you use? I can't seem to get this - US30 - on the MT4 platform I am using, so was going to use the free charts on FreeStockCharts.com, but can't get the US30 either, but got amongst others the DJ-30, which prices seem similar to the US30 in your examples.
YES - use them

hey,
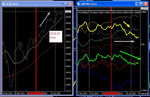
yes, you are absolutely right. If you buy E/U and short G/U you end up buying E/G.
But the point I am trying to make is that in general E/U and G/U are highly positive correlated instruments. So you wait till the correlation breaks down and pairs move in oposite directions and then you tade accordingly. 🙂
And yes, the scaling issue is something I am working on.
And another yes for the MA-Crossover. That's a good thing ;-)
( I also mailed you ;-) )

Thanks for your feedback and you got some valid points. I am not trying to convince you, just exchanging ideas and views 🙂
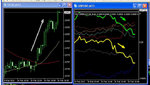
Here you can also see the corrleation table. 93% ~ on a weekly basis (watch out, at one point it broke down big time and that's when you need rules to exit), 86%~ and a daily basis. And you can see how the correlation varies on an intraday perspective and that is exactly what I think makes it attractive.
Maybe some food for thought ;-)