Clown's 2007 outlook is work in progress

the week ?

DDC,

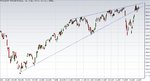
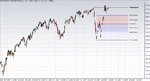
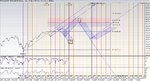
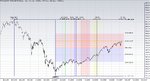
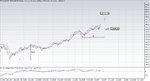
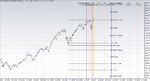
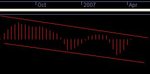
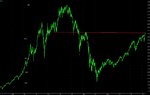
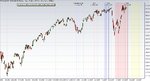
In the week chart, there are some signals which I am looking carefull at. You find my conclusions in the chart. Also another fact that stikes me is the ND from week ending 23-02 and 23-03, the first one since long time.
Enough for me to be carefull. And you know, Het kan Vriezen- het kan dooien :))

KvKd
 

Attachments

  • AEX WEEK 01.gif
    AEX WEEK 01.gif
    43 KB · Views: 206
het is heerlijk in het zonnetje

DCW,

The AEX week chart shows negative divergence and if drawn correctly you will find that the line extension has already been tested once successfully. The bounce from the extended line did however provide one of the illustrious Technical Analysis New School signals. From an analysis point of view the so-called festivity of recognition lies in the crossing of the above signaling.

The 512, if you recall our conversation with GJN some time ago, is a derivative by origin and in the more practical sense should be viewed as a more flexible region. Sit down for a minute and consider the options carefully and combine the beauties which are already in a number of charts.

The best things come fast and hard.
 
The Dutch Clown said:
DCW,


The best things come fast and hard.

DDC,

Right you are, trend + until proven otherwise. Suppose you meant the "Abraham" line :)
And indeed in other timeframes also. The old fashion ZigZag might be usefull here. :cheesy:

KvKd

NB: Had a nice conversation with the "Kleiduivenschieter" this afternoon to wish him all the best.
 
Are we really still going up?

There seems to be a lot of doubt. A possible change is due next thursday. The trend is still up, but we are testing the bottom trendline an awfull lot of times. Somehow we have to leave the triangle soon. Its closing at 521 the 2nd of May. We left once at about 38,2% before the end, but we got back in. Thursday the bottom will be at 512,40. That's also the line of a strong resistance. We'll see.
Happy trading,
Pacito
 

Attachments

  • aextriangle.jpg
    aextriangle.jpg
    270.8 KB · Views: 182
  • aexgannbars.jpg
    aexgannbars.jpg
    271 KB · Views: 154
  • fibo.jpg
    fibo.jpg
    249.7 KB · Views: 172
Het was weer een mooie dag

The Technical Analysis New School provides us our shopping list and the trending side is in sync with that list. This is only the price parameter of the Analysis the time parameter was building up the movement potential through the day to put a new multiple year high on the board. It is not unthinkable that some additional power will have to be pumped up which is not so extraordinary given the performance that has to be delivered.

Just to remind you that the stockmarket does not travel a straight line between two points so use the shopping list to make some extra money swinging. There are several way’s to execute Money Management the simple ones are the best however depending on what products you are using. Personally I fancy the FTI’s and play with the number of contracts to manage the money.

Since price is the one thing people seem to understand best let’s do a projection of a part of the tools into a price chart and get a feel for what the current Bull Range Rule provides from a potential point of view. Please note that this exercise is a dynamic implementation so the projected values have limited lifetime. An other way of looking at it from an indicator learning point of view.

Have fun.
 

Attachments

  • aaa.jpg
    aaa.jpg
    118.5 KB · Views: 241
Het was gewoon weer een mooie dag.

The AEX has entered a phase that wakes up the guru’s to dump their views on us and the two I have read and feel I can see where they are coming from throw 530 and 400. The joke when looking at the merits is that they both might be right and wrong and each combination of the two, so the only people who win are those who truly disgust anything to do with Technical Analysis. Yes I am sure a bunch of others have as many different views however it should be somewhat transparent in the way they generated their conclusions.

Let’s play ball and remember the phrase: a trend remains a trend unless proven otherwise. Even if you don’t use the more sophisticated tools around just one glance at the board tells you we had an other multi year’s high today. Sure there is something cooking and you should not stick to positions (trading that is) too long even with some form of protection. One of the beauties out of the new school is the implicit definition that when a trend is up the resistance is not relevant it’s the support you will have to watch like a hawk.

The chart I have put up yesterday has an additional bar and I therefore update it please bare in mind that the projection is a dynamic range which even is more strict than the Brown view.

Have Fun.
 

Attachments

  • aaa.jpg
    aaa.jpg
    111.8 KB · Views: 233
Still going strong

It seems that we lost the brakes and the whole thing is running thanks to its own weight. Possible change is still lurking after the weekend, but I will not even try to make a prediction of what we are going to see next week. On the long term however, I changed my upchannel a bit. I moved it to 3 weeks earlier. I didn't change the rest. So the top is still in june somewhere between 530 and 550.
Pacito

There's only one important resistanceline in the near future: 532,x. The next one (long term) will be 585,x. Uptrend supportline 503,x. It should be notified that what was long term in the past seems to shift to medium term at the moment. Also medium term seems to shift to short term. So everything is changing somewhat faster nowadays. Or I get slower ;)
 

Attachments

  • 1.jpg
    1.jpg
    421.1 KB · Views: 188
  • aextime.jpg
    aextime.jpg
    312.9 KB · Views: 166
Last edited:
I wonder what next week will bring. I see resistance levels, looking at the price chart and the RSI chart (upper part lower window). There might be a (small) pullback, before the uptrend resumes. Also the KKK-indicator is high, so from that point of view the AEX might go down. What puzzles me most is: "why didn't we see a short squeeze yesterday afternoon, when the AEX broke trough the 518-519 level?".
 

Attachments

  • aex20070405.gif
    aex20070405.gif
    41.2 KB · Views: 163
Week 15.

The Elliott wave outlook remains unchanged from a long term perspective and the six out of six continue to point upwards. So in order to find some clues for trading we have to dig a bit more and look at the 469,85 and 503 pivots. The 469,85 continues to show the last weeks preference wave III on 515,86 and given the new multi year highs makes 503 wave IV so we are looking at wave V as best scoring scenario.

The FUD campaigners are becoming extremely aggressive and even some of the more or less serious Analysts are looking downwards with somewhat outrageous targets. One of the issues is the Negative Divergence in the monthly chart however you might recall the GJN December 2005 outlook and what actually happened instead. So rather look at what kept him running just one year later in an identical situation the trend is a trend and subsequently the focus on support and not on resistance levels. Mind you the distinct difference here is not using the Negative Divergence as a trading signal to enter short position. From a trading perspective is it a warning signal to tighten the Stop-Win and watch it more carefully. The Analyst can afford to be wrong for a month or so whereas the Trader is losing money.

In order to make some money trading we should be able to find a way to define the active trend in it’s full glory in accordance with the K.I.S.S. philosophy. However there are different phases that are best captured by different techniques and\or indicators. The Brown line of thinking points in the direction of Ranges so let me use those so everyone knows how to look at the presented pictures although some of the used techniques are adjusted. These derivative smoothed ranges can be projected in a price chart and present a range in price for the given chart like the ones you see in the above posts.

The Technical Analysis New School as mentioned for some time now has delivered a shopping list with targets to meet and last week we have seen the first two on the board. The multi million dollar question is if we continue to score the targets on our shopping list or are we having an additional swing in between.

Have fun trading.
 

Attachments

  • aaa.jpg
    aaa.jpg
    86.1 KB · Views: 233
Hoezo mooi weer? Er komen nog een paar mooie dagen.

Don’t forget to unwrap your present that was left for you in the intraday chart. Even if you have missed it look for the next entering beauty that is currently building up and just needs to be unfolded in the relevant charts. The Derivative Oscillator might help out here since you should be looking for peer resistance at two levels first and divergence to complete to picture.

The AEX has left the range at close today and will need confirmation entering the next range or return into the left range. To give you an idea what AEX values correspond with the next range I have attached both ranges. So a trend is a trend as long as the trend remains a trend just to illustrate the relevance of the trend once more. And don’t forget the support levels are the ones to watch.

Have fun.
 

Attachments

  • aaa1.jpg
    aaa1.jpg
    114.5 KB · Views: 225
  • aaa.jpg
    aaa.jpg
    125.2 KB · Views: 225
Dear Clown,

Thanks for your update. Unfortunately I am clearly missing a huge signal. I'm just learning continiously from your posts,however I can't place your last one really, if I am honest. If a have a look at the 1 hour-chart I see a PR in the FTIchart what I objective of about 532 (bare in mind also some fibo's in that region). Range-rules clearly still in bullrange. Day-chart also getting into bull territory.

I admit a wave down is very good possible but I don't get any clear signs for that now. Could you give a slight tip?

edit: Another question if I may, Brown has definately warmed up my attention for Gann. What was your advice to start with on the subject?
 
Could this be the Indian Summer?

After today's close there are only a few resistancelines, 531,x 544,x 578,x. Are we reliving the 90's, climbing a wall of fear? The continuing uptrend with only one serious correction in may/june last year. The one end februari was over before you could blink your eyes. Is Gann able to help us here? The next change of trend could be about the 9th of may or the beginning of june. Untill now there's certainly an uptrend so go with the flow.
Pacito
 

Attachments

  • 1.jpg
    1.jpg
    280 KB · Views: 160
  • gannfibo.jpg
    gannfibo.jpg
    308.6 KB · Views: 167
Gaat er al een belletje rinkelen...

The GJN legacy does not seem to have found much soil since one is turning to the old school again. As mentioned in practically each post lately the support levels are important and not the resistance levels they should be replaced by targets on your shopping list. The real beauties are the complementary signals like you will find in your intraday chart today as anticipated yesterday.

Look for the jvdlow accelerator as well and have fun riding the trend wave.

EDIT:
next turning support potential?
 

Attachments

  • aaa.jpg
    aaa.jpg
    31.9 KB · Views: 190
Last edited:
The Dutch Clown said:
The GJN legacy does not seem to have found much soil since one is turning to the old school again. As mentioned in practically each post lately the support levels are important and not the resistance levels they should be replaced by targets on your shopping list. The real beauties are the complementary signals like you will find in your intraday chart today as anticipated yesterday.

Look for the jvdlow accelerator as well and have fun riding the trend wave.

just a picture
 

Attachments

  • aex20070411.gif
    aex20070411.gif
    20.6 KB · Views: 193
I'm not too sure about the uptrend & supports at the moment.

I don't post here much so I'll give a small introduction:

I have been trading with more advanced TA for about a year now and I have mostly been using Gann for price/time/trend prediction. About 3 weeks ago I started with the o so famous book from C.Brown which has given me some interresting new insights on trading but also some confusion since I had a pretty good forecasting technique already.

The reason I don't feel confident about the rally proceeding is mainly because of Gann.
472,5-512,43 is a very important range for me and should by expectations be of influence for some longer time with volatile movements.
Also 524 is a very important turning point which we have reached in the last 2 days and seems of influence on the current market. I expect this to become more influental resulting in a small trend change.

Additionally, after advancing in the book of connie I found a nice signal on the weekly chart which I interpereted as negative (attached). I'm not too sure if i'm right on this point though since I'm new to this.

GL
 

Attachments

  • Clipboard02.jpg
    Clipboard02.jpg
    7.1 KB · Views: 154
Last edited:
Hello again

Good evening,

It's been a while since my last post. It ended with quite some colourful pictures. Well, today is a bit the same. But I want to show you something about fibo's and lots of it. How to place them in your charts.
On the other forum there was a discussion about the 61,8% level. In the earlier posts I mentioned a target of 523,86 Brown have said to all of us to place them on the body of the candle. Not on the shadows! So when you do that in the daily chart you will find: 403.19, 460.27 and 517.34
In the weekly you'll find: 412.77, 467.31 and 421.86 Because a trend is a trend..... The beginning of March the daily and weekly trend was broken, but the monthly was still ok. So when you measure the body's of the monthly candles you'll get an other result: 418.49, 471.10 and last but (I think) not least, 523.70 Ring a bell with these last targets?

Because this game can be played in all time-frames I give you a chart of today with fibo's. Same colours are same fibo's. The purple is the opening-candle at 9 The target was 3.618% The gray one is the fibo of the last swing of today. Look at all targets.... exactly 400%
The red one's are todays swing. Look at the left one how nice it all fits....

The other picture shows you my trend.

All comments are welcome

Blinker
 

Attachments

  • Fibo's.gif
    Fibo's.gif
    44.1 KB · Views: 222
  • Tranding.gif
    Tranding.gif
    7.3 KB · Views: 178
Last edited:
The postman always rings twice

The Dutch Clown said:
The GJN legacy does not seem to have found much soil since one is turning to the old school again. As mentioned in practically each post lately the support levels are important and not the resistance levels they should be replaced by targets on your shopping list. The real beauties are the complementary signals like you will find in your intraday chart today as anticipated yesterday.

Look for the jvdlow accelerator as well and have fun riding the trend wave.

EDIT:
next turning support potential?
Oh yes, I heard the bell ringing ( <522). I know the support levels are important in an uptrend.
Let's turn the whole thing around. We're in a supercycle downtrend. Its a bit weary to use trendlines from supercycles and then talk about cycles, primary's, intermediates and so on. The 531,x is a line of the supercycle. So lets consider it as such. Then its a resistence in a downtrend. And, as we know, in a downtrend the resistancelines are the most important. I'm not suggesting we couldn't cross it, but I think it has to be considered in the right timeframe.
 

Attachments

  • aexsuper.JPG
    aexsuper.JPG
    72.4 KB · Views: 169
En van je hela hola...

The Derivative Oscillator was in fact your differentiator today and once again gave away the intraday movement although I have to point out that again the combination of used techniques helped an additional bit. The 503 KVKD trending area system midpoint together with an overbought RSI put up a threshold and in the end took it’s Stop-Win exit based on the dynamic Range Rule RSI. In this swing a bridge too far, however we are already in the potential next swing area so the festivity of technical recognition is about to start all over.

Moving back into the previous range and pickup the AEX there again don’t forget to read page 58 once more just in case you have forgotten. The intraday potential turning support is still functional (see above post attachment) and will play a crucial role tomorrow. First we need to establish where we are going to continue from a range rule point of view since the AEX closed just below the intra day bull range.

Just so you will know the difference between a static range and an dynamically adjusted range so attached you will find the optimized intraday stop-win (the green line) I have used the last couple of day’s. Mind you there is no simple straight answer it’s the combination of all the beautiful techniques and indicators that make your trading life fun. So get your lazy butt of the couch and go to work trading for a living is a job you know not a hobby.

Have fun.
 

Attachments

  • aaa.jpg
    aaa.jpg
    129.7 KB · Views: 213
  • aaa1.jpg
    aaa1.jpg
    160.6 KB · Views: 199
The Dutch Clown said:
So get your lazy butt of the couch and go to work trading for a living is a job you know not a hobby.

Hobby here! I always read your posts, but never know if you're saying we're heading up or heading down.....in fact, I might as well be reading the calibration guide for the Hubble space telescope.
 
Top