Bullish/Bearish - Meaningless?

TheBramble

Legendary member
Messages
8,394
Likes
1,170
Re-reading Taleb's "Fooled by Randomness" and there is something in there which relates strongly to a number of recent discussions in this group on trade size, probability, stop-loss and general trend derivation. (Which is why I've started a new thread rather than try and 'fit' it into an existing one).

Scenario:
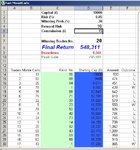
You strongly believe that your index/market/stock of choice today has a 70% chance of rising and a 30% chance of falling AND if it goes up, it;'ll go up by say 1% and if it falls, it'll most likely do so by as much as 10%.

Question 1:
Are you Bullish or Bearish that index/market/stock?

Question 2:
What would your trading strategy be?
 
I don't want to sound like a clever clogs but...

The 70% of a 1% gain sounds like a low risk opp.
30% of a 10% gain sounds unlikely, but a good opportunity if it arose. So...

I'd watch the market. Lets say I was going to trade a 1000 lot. If I saw the the market take the long, I'd enter, but put my stop at the intended entry to go short. This order would be for 2000, 1000 to cover, the extra for the short. I'd do the opposite if I got the short signal first.

This way, I don't care what the market does, because I will win either way given the probabilities you stated :)

The force will be with me young BBB!

Jedi Trading Rules OK!
 
set a stop @ 0.75 % ..and take the trade..

Straight forward
 
Bramble,,
you said if it goes up . it will go up by 1% ( reward)..

So if I take a smaller stoploss say 0.75% then I have a greater than 1 R/R with a chance of 70 win against 30 loss..

Not a bad deal ..
 
lads I am new here - and i dont want to say things ppl dont like - but i think this is important - so let me respectfully disagree.

70% odds of up 1 point, 30% odds of down 10 pts = expected payout is -10*0.3+1*0.7 = -2.3.

we want to capture big trends, right? In this particular set-up (btw u realise that such odds negate the normal distribution assumption, so by definition it is not an efficient market) I'd be Short with a very tight stoploss to the upside.
 
China, the original was 70% chance of a Long move of 1% strength (not point) and 30% of a short move of 10% strength (not points).

However, I understand where you're coming from and I don't believe the mis-translation from absolute points to relative percentages changes your stance or your reasoning.

Apart from other traders' trading strategy on this scenario, I was keen to examine whether it is considered a Bullish or a Bearish position - or if indeed, those concepts were quite meaningless - hence the title of the thread.

As for an 'efficient market' - do we believe the textbook definition applies to what we trade each day - really?

Thanks for your inputs - which are very interesting.
 
let me just clarify what I said.

this simple example of 70% chance of up 1 and 30% chance of down 10 - is not that simple at all - it is a classic binary tree, which (even tho it can be accounted for in options calculation) IS NOT a lognormal distribution which is what we assume we r trading. THERE IS NO POSSIBLE volatility skew that can "tweak" a lognormal distribution into a binary tree.

anyway let me give u an example. Assume this situation happens 10 times - what r we gonna get on average? I am making things worse for myself and assume I am short WITHOUT any stop loss.

1) Grey1's trade (sorry mate :) ): L with 0.75 stop loss. This trade will return 1 7 times and lose 0.75 3 times = 4.75 on average.

2) S trade without any stop loss: lose 1 pt 7 times and make 10 pts 3 times = 23 pts profit on average.

I am not even talking about such a nasty thing that -10 cases will be gaps down so 0.75 pt stop losses will actually not work - u'll be stopped out at exactly -10.
 
btw - sorry to post so much - let me make it clear what I mean by being a bull or a bear.

E.g. ME BEING A BEAR DOES NOT MEAN THAT I THINK THE MRKT WILL GO DOWN!!! MORE TO THAT, IT DOES NOT mean that THE ODDS of mrkt going down r higher than THE ODDS of mrkt going up (even tho it is close and in most cases is the same). What it means to me is that THE EXPECTED PAYOUT of being short exceeds the EXPECTED PAYOUT of being long, to the best of my assessment of the current market.

Trading imo is 50% odds management and 50% money management (aka discipline).

In the above example the expected payout favours short - and by a huge mile IMO.
 
China White

Looks like I'm not the only insomniac. I agree with you, keep it simple Mathematics and discipline are the way to get the most out of the market.
 
China,


with 70 % success rate, reward/Risk = 1/0.75=1.3 input into the Monta carlo simulation I would be doing well if I went long ..


The comparison IMHO in here is not between having two strategies one with 30 % win rate but R/R of 10 against another with 70% win rate and a R/R of 1.. Theoretically the former will beat the latter but could you imagine if you have just lost 9 trades waiting for the big win to run its course? I do not know many traders who take the full meat out of a trade once lost 9 times prior to that..

This is why I am totally against high losers systems with one big win ( trend following ones..)
 
Last edited:
Grey1 - sorry mate :) - u r tweaking the rules of engagement :)

Quote: "lost 9 trades waiting for the big win to run its course". Of coz, if it is 90% chance of +1 and 10% chance of -10, then the expected payout = 0.9*1-0.1*10 = -0.1 - and even tho IT IS STILL MARGINALLY IN FAVOUR OF SHORT - I'd be in your camp and go Long, because this is where stopp loss comes into play:

1) Long: 9 times +1, 1 time -0.75 = 8.25 profit

2) Short (even assuming I put a 0.5 stoploss to the upside): 9 times -0.5, 1 time +10 = 5.5 profit - LESS than in Long.

However 70/30 odds with 1/10 rewards - as in the original example - makes Short preferrable IMO :)
 
China

My Quote "

Theoretically the former will beat the latter but could you imagine if you have just lost 9 trades waiting for the big win to run its course? I do not know many traders who take the full meat out of a trade once lost 9 times prior to that.. "

This does confirm your findings but what I was referring to was a finer point..

The above example is a classical probability quiz which the answer is well known within the community.. However we are traders and one thing is most important and that is whether a trader could implement the 30% chance for bigger profit in real life or not ..

The answer is NO .. if a trader loses 9 times then it would be devastated to let the winning trade to run its course..

SO where does the 9 number comes from .?.

Even though a system might have 30 % success rate ( 3 wins 7 loss ) but the worse case scenario could be a lot worse hence the figure 9.

I am posting a 30 % system for you to see from 100 trades only 20 with winner which is 2 winners out of 10.. ..( The result could be 1 from 10 if i run the simulation longer )

The origin of this quiz goes back to market only trending 70 % times and oscillating 30% and is pretty well known argument and whether one should be using oscillatory or trend following system to trade the market..

My strategy would always be to take the higher win system with lower reward than a trend following one with a one great win ..

PS:-- there is one more variable here and that is the probability of pay outs in both cases but I have not brought that to the attention of our members because it only get things complicated and we might lose the light of the argument.. ( if you notice bramble's post mentions MOST LIKELY which is not a 100 % statement.. tricky hey )
 

Attachments

  • run1.jpg
    run1.jpg
    171.5 KB · Views: 34
Last edited:
Quote: "lost 9 trades waiting for the big win to run its course". Of coz, if it is 90% chance of +1 and 10% chance of -10, then the expected payout = 0.9*1-0.1*10 = -0.1 - and even tho IT IS STILL MARGINALLY IN FAVOUR OF SHORT - I'd be in your camp and go Long, because this is where stopp loss comes into play:

China/Grey1

So using this Expected Payout equation, what would constitute a realistic/benchmark EP? I guess 0.2 springs to mind as the average text book/historical return of a stock index?
 
Grey1 - i think u r right after all and I'll tell u why. If it was a card game :) and we were GUARANTEED 10 plays with the same odds - my strategy wud be best.

However, we r traders and we r given 1 shot. Noone can guaratee this situation to repeat itself 10 times. SO U GO WITH THE ODDS (with a stoploss) rathen than with Expected Payout.

It is funny u brot up Monte Carlo. In my younger yrs :) I had publications on Monte Carlo simulation of secondary high energy emissions coming from solar flare loops. Useless stuff really :) What randomiser r u using? I was using that fossil FORTRAN 77 randomiser for Monte Carlo - which actually was quite good....

BBB - theoretically the expected payout of the stock mrkt for any given period of time T is EXP(T(r-d))-1, where r is the current interest rate and d is the dividend yield of a particular index.
 
Top