You are using an out of date browser. It may not display this or other websites correctly.
You should upgrade or use an alternative browser.
You should upgrade or use an alternative browser.
Racer
Senior member
- Messages
- 2,666
- Likes
- 30
There might be a few things here.. but site is trying to sell but a few snippets available
http://www.bollingerbands.com/services/bb/?type=intro
http://www.bollingerbands.com/services/bb/?type=intro
I don't know; but I can offer you _a_ method for using them which I believe works. I call it "The 28 Method", for reasons you'll see.traderjuk said:Bollinger Bands: What is the most effective method for using the above.
Using any 1-hour Forex chart of a currency pair which is not strongly trending, with BB set to 28 and 2.8 and a 12-period RSI, enter long when the price crosses the lower BB for the first time in 12 hours if the RSI is below 28; enter short when the price crosses the upper BB for the first time in 12 hours if the RSI is above 72.
I have used this method for buying 2-hour digital options at BetOnMarkets, by "fading the breakout", as it were. As soon as the price touches the BB with an appropriately "overbought" or "oversold" RSI (how I hate this terminology!), you buy an option for the price to be higher/lower 2 hours later (plus a few minutes because you can't buy an option which commences with 5 minutes of buying it, if you see what I mean).
I've also heard of people doing the same thing, but with a 30-minute chart, and buying 1-hour options instead, but I have no experience of that myself. The principle seems exactly the same, though.
This method trades only occasionally, but in my experience with about a 65% strike-rate (at an "evens" pay-out, less 2% commission). Profitable but not spectacular, in other words. And not at all suitable for people wanting frequent trades, of course.
TheBramble
Legendary member
- Messages
- 8,394
- Likes
- 1,171
When price goes through either of the bands, lots of people think the price will reverse.
You can either side with these people or view the BB as a 2SD which it is - which gives a useful probability of elasticity.
On the other hand - you may just choose to trade the masses interpretation... 😎
You can either side with these people or view the BB as a 2SD which it is - which gives a useful probability of elasticity.
On the other hand - you may just choose to trade the masses interpretation... 😎
FetteredChinos
Veteren member
- Messages
- 3,897
- Likes
- 40
fade a close outside the bollinger bands on daily charts. close any trades entered 2-3 days later.
hey presto a strat that works in the long run, certainly on the indices. havent tested stocks, but i see no reason why it shouldnt work.
FC
hey presto a strat that works in the long run, certainly on the indices. havent tested stocks, but i see no reason why it shouldnt work.
FC
TWI
Senior member
- Messages
- 2,562
- Likes
- 269
Better to wait til price breaks back into bands before placing trade or you get caught on the big breaks. The more sideways the price action the better, this is pretty obvious because you can see the angle of the channel.
If channel is more sloping then only consider using the band that goes with the trend as an entry.
If channel is more sloping then only consider using the band that goes with the trend as an entry.
Rhody Trader
Senior member
- Messages
- 2,620
- Likes
- 266
The reaction to exceeding the Bands varies A LOT from market to market. In Forex, for example, when looking at a slower moving pair like AUD/USD or USD/CAD, I get very cautious when I see a Band broken, especially on a closing basis. Those breaks don't tend to persist more than a period or two, especially in the longer timeframes. For something like EUR/JPY, however, I don't really concern myself with the breaks unless I get other indications that a consolidation or reversal is likely coming.
It really all boils down to knowing the market you trade and how the indicator tends to react with it. Observation.
It really all boils down to knowing the market you trade and how the indicator tends to react with it. Observation.
-oo0(GoldTrader)
Well-known member
- Messages
- 345
- Likes
- 5
Lane's Stochastic "3 lines"
Hybrid Thread
These two should complement each other well because one is momentum, while the other is volatility. Ross has a chapter on how to use Bollinger's on spreads. The distinctive characteristic of Bollinger Bands is that the spacing between the bands varies based on the volatility of the prices.
Stochastic is a momentum oscillator used to detect the changing velocity in trends. Slow Sto is too slow for futures. You can see for yourself when you chart all three over price.
%K, %D and slow D.
traderjuk said:What is the most effective method for using the above, also what can they be combined slow stochastics to give reliable signals?
Attachments
Last edited:
Continuing Goldtrader's theme :
I use Bollinger Bands, Keltner Channel AND Momentum (using Bollinger Bands) on the same chart.
This I refer to as the Volatility Squeeze Indicator
Bollinger Bands are a graphical representation of price volatility, shown as bands around a moving average. The distacne between the bands is calculated using 2 Standard Deviations, shown as one line above the MA , and one line below.
The formula is a bit complex, so please refer to:
www.futuresource.com and click Charts> Study Help> Bollinger Bands.
The Keltner Channel is a volatlity envelope based on the Range High-to-Low daily
Momentum is the rate-of-change, or speed of a directional move in price.
I use all three indicators on the chart . Method is as follows:
When The Bollinger Bands touch/enter the Keltner Channel, a Volatility Squeeze is set-up. This will inevitably lead to a breakout, and sharp move upon expansion of the bands (volatility) once again.
To determine the LIKELY direction of the breakout, I use MOMENTUM DIVERGENCE to price.
If there is BULLISH MOMENTUM DIVERGENCE + VOLATILITY SQUEEZE - GO LONG
there is BEARISH MOMENTUM DIVERGENCE + VOLATILITY SQUEEZE - GO SHORT
Other qualifying factors sometimes come into consideration, such as the outcome of recent 'Squeezes' and the prevailing market trend on the time-frame in question.
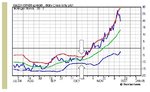
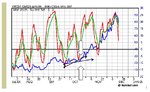
As an example, here is MAY NY COFFEE 30-min Chart (I only trade commods these days)
At the area highlighted, we have :
1) A VOLATILITY SQUEEZE (Bollinger Bands touching Keltner channel) AND
2) BULLISH MOMENTUM DIVERGENCE (Price makes equal low, Momentum makes Higher Low)
The Buy signal was thus given, and the market duly broke out NORTH, and is now over 1000 points higher in 2-3 days.
[
I use Bollinger Bands, Keltner Channel AND Momentum (using Bollinger Bands) on the same chart.
This I refer to as the Volatility Squeeze Indicator
Bollinger Bands are a graphical representation of price volatility, shown as bands around a moving average. The distacne between the bands is calculated using 2 Standard Deviations, shown as one line above the MA , and one line below.
The formula is a bit complex, so please refer to:
www.futuresource.com and click Charts> Study Help> Bollinger Bands.
The Keltner Channel is a volatlity envelope based on the Range High-to-Low daily
Momentum is the rate-of-change, or speed of a directional move in price.
I use all three indicators on the chart . Method is as follows:
When The Bollinger Bands touch/enter the Keltner Channel, a Volatility Squeeze is set-up. This will inevitably lead to a breakout, and sharp move upon expansion of the bands (volatility) once again.
To determine the LIKELY direction of the breakout, I use MOMENTUM DIVERGENCE to price.
If there is BULLISH MOMENTUM DIVERGENCE + VOLATILITY SQUEEZE - GO LONG
there is BEARISH MOMENTUM DIVERGENCE + VOLATILITY SQUEEZE - GO SHORT
Other qualifying factors sometimes come into consideration, such as the outcome of recent 'Squeezes' and the prevailing market trend on the time-frame in question.
As an example, here is MAY NY COFFEE 30-min Chart (I only trade commods these days)
At the area highlighted, we have :
1) A VOLATILITY SQUEEZE (Bollinger Bands touching Keltner channel) AND
2) BULLISH MOMENTUM DIVERGENCE (Price makes equal low, Momentum makes Higher Low)
The Buy signal was thus given, and the market duly broke out NORTH, and is now over 1000 points higher in 2-3 days.
[
Attachments
Rhody Trader
Senior member
- Messages
- 2,620
- Likes
- 266
See the article in the Knowledge Lab for some interesting tidbits from Bollinger himself has to how he approaches the application of the Bands.: www.trade2win.com/knowledge/articles/bollinger-bands--the-basic-rules
Trader333
Moderator
- Messages
- 8,766
- Likes
- 1,030
On the other hand - you may just choose to trade the masses interpretation...
...and suffer ongoing losses
Paul
Similar threads
- Replies
- 15
- Views
- 33K