shotgun77
Active member
- Messages
- 128
- Likes
- 2
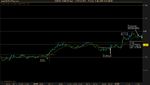
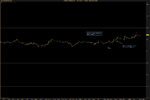
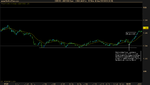
P.S.: I'd love to hear your comments on that particular BB (3rd chart) setup in general.
It looks like that BB could also have an angular line on it and its break would have gotten you in a bit sooner.
P.S.: I'd love to hear your comments on that particular BB (3rd chart) setup in general.
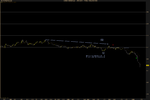
My charts with notes.
I did about every foolish mistake I could today - forgot about news announcement, accidently exited a valid trade and missed a textbook setup because I was surfing the web. Nevertheless, I really liked the market today, I think it behaved very technically 🙂
P.S.: I'd love to hear your comments on that particular BB (3rd chart) setup in general.
I skipped that DD because I'm still paranoid about those around 00 levels. It's like I burned my hands one too many times for me to feel comfortable trading them.
Does this volman price action really work for you guys?
Do you guys all have other jobs? Full-time or otherwise? Or do some of you purely trade?
If trading isn't your main source of income how do you manage it all - time to study, rehearse, experience etc etc?
Personally, I find the juggle pretty tough with a full-time job and 2 young children. Am beginning to wonder if it's all really worth it, given the countless hours one must put in to become consistently profitable.
Would appreciate any thoughts on the matter, and maybe some encouraging words. Feeling a little unsure about it all.
Yeah, it takes a lot of practice, but if you get good, it has a nice risk/reward ratio.
Let me raise a constructive issue about range breakouts with this method?Some of you skip them.How do reduce false breakouts , iffy breakouts and random noise breakouts?
Following breakouts are better opportunities
a)The second breakout is a confirmation sign of market intent , two false breakouts is rare.
b)new trending breakouts with hh or ll tend to be in tune with markets
c) following underlying and preceding trend
d) backed with fundamental price drivers
e) Bounce off (rejection)previous resistance / support breakout
f) momentum breakouts
What types of breakouts do you avoid with this method?


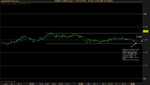
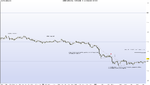
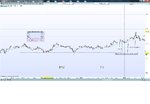
I think it is a valid inside range though more extended inside range than the ones in the book. And maybe you would even lower your barrier to it and call it the main range and call the DT as overshoots of the range or failed breaks. The important thing is to see the fight going on. To my eyes, the bears are fighting hard to push prices lower. But each break lower is met with bulls. Bulls finally start to win and make higher lows. The low before your arrow is a micro-DB so found support. So you have 4 pushes at the same high and a break-through. Got to be double pressure there. It looks like that is where you needed to get in to make your 10 pips before the 50 level pushed it back down.My question is how would you handle the situation in my 1st chart (range inside a range)?
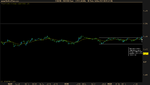
My charts with notes.
My question is how would you handle the situation in my 1st chart (range inside a range)?
@samich1262 - Maybe it is an ARB but I feel sure I would have missed it real-time. Chart is just not clear enough and with ARBs, I've found it pays to wait for clarity. So I would definitely have missed the move. I do like your boxed area as an IRB. Not quite room for 10 pip unless upper barrier breaks so you'd have to be on alert to exit at the top.


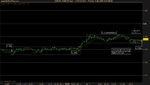
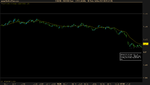
AHhh I slept through my alarm for an hour and missed an easy RB/IRB.. Looks like it had a couple 2nd chance entries too.
View attachment 149784
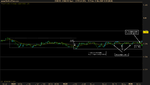
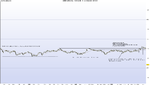
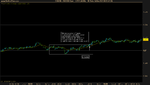
This next chart was a bit too unclear for me to trade. I was wondering what your thoughts were on it. I was watching this possible ARB on the GBP/USD. I know it's a different pair but it's an interesting chart. Do you think this looks like a valid ARB? I wasn't sure, but there's a nice clear barrier and two ceiling tests before price breaks out of the range. That block may have been a good IRB coming after a triple bottom if it had contained more bullish price action. Pressure looked too even to me, price wasn't able to close on the barrier. I suppose I could have moved the barrier down 1 pip but that would make the barrier level a little unclear...Anyways... following that possible IRB (which is a ceiling test of previous price action to the left), price climbed to the top of the range, and then came back down and tested the IRBish block. It is a ceiling test after a teaseWhen that ceiling test was successful, I thought it might be a possible ARB. It's technically found bullish support within the range twice, taken control of the 40 level and tested the 50 level 3-4 times. Seemed like a test of the 60 level was likely, but the setup wasn't particularly bullish. What do you think?
View attachment 149782
No trades for me today. I was watching the same range on the GBP/USD that samich was but I could not see a good entry at the time.
My charts with notes.
My question is how would you handle the situation in my 1st chart (range inside a range)?