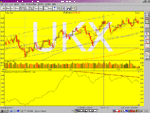
Granville gives the following principles for interpreting the Advance - Decline line:
When the market average falls while the A-D line is rising the market will turn up.
When the market rises while the A-D line falls , the market will turn down.
The strength of such a market rally or reaction will be signalled by how much the price average differs in course from the A-D line, and for how long.
The A-D line, taken alone, does not indicate precisely when such a rally or reaction will occur, but only that it will occur reasonably soon.
When the market average approaches a previous top and the A-D line is below where it was when it made that top, the market situation is bearish. If the A-D line is above where was when it made that top, a break through to new highs is imminent.
When the market average approaches a previous low and the A-D line is well above where it was when it made that low, the market situation is bullish - that is, the previous low should hold. But if the A-D line is below where it was when it made that low, then a down side penetration is imminent.
As a long term investor ( I have been investing for about 30 years) the graph bothers me, as I am starting to commit more cash into stocks. The market is telling me there are more sells than buys on average in the market, the A-D line is
diverging from the Ftsie 100. Do I believe what I am seeing- as TA can kick you up the backside at times.
All the best Bill