MACD strategy

asimpleplan

Member
Messages
63
Likes
3
Hi,

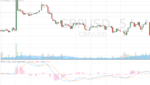
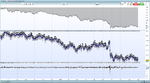
I'm sure most people on here are familiar with this indicator.

However, when I tried applying this strategy in the FXCM demo, my few dozen trades resulted in my account being at a loss of about 30 pips. It's not enough trades to have any complete certainty but it demonstrates the point.

It obviously raises lots of points about how to use stops and where exactly to exit the trades.

With FXCM I believe the minimum stop is 10 pips. Can this be moved tighter once the position is opened so as to protect a position?

Obviously the MACD can be applied to any time frame; let's suppose trading the 5 min chart..watching the 1 min chart will assist in judging when to exit.
 
Most people are familiar with this indicator but an indicator isn't a strategy. What are you looking for on the MACD to tell you to enter trades? Do you use it to exit trades too?
 
So you're saying the crossover signals both ways are signals to enter and exit positions?:smart:
 
Last edited:
You're wasting your time focusing on macd. If it were so simple everyone would be minted
 
If it were so simple

Nothing ever is, is it? Still, it's a powerful indicator. Combined with price action analysis and a couple of other indicators must surely be the right direction.
 
MACD is nothing more than diff b/w 2 MA's. And MA's lag baaaaaaaaadly! Your always behind the price...

i use nothing more than a 15 min chart, a few levels and my eyeballs.
 
uN26qr9O


Look at the MACD crossovers.

1
2(not marked)
5
9
11
14

OK, this is only 'one third of the picture' (as someone told me) but it's first base. Stops and money management are obviously the next steps BUT these MACD crossovers seem strong to me.

Judging from this graphic, the signal line crossing back over the MACD seems like a good place for exits.

The other variables is the Stop loss strategy and whipsawing?

P.S. The other numbers are just trades based on price action (2 consecutive trending candles and then Long/Short 1 pip above/below the close of the 2nd)
 
I like the MACD, it's one of the few indicators I have found any value in. But I only use it to help me visualise market structure and I don't use it on standard settings.
 
how did this one work out for trading the crosses? ;)

a recipe to get whipsawwed to pieces...
 

Attachments

  • gbpusd.PNG
    gbpusd.PNG
    58.2 KB · Views: 299
Ah, you've picked a consolidating/ranging time period - probably out of main trading hours. Yes, trading main pairs out of hours is probably a dumb idea. Even a newb like me twigged that.

Why don't you show me a table of backtested MACD crossovers between 7am-10pm UK time for all the main pairs?

Anyways, now you mention the non-random out of hours pre-selected chart, let's examine the crossovers:

1) plenty of pips
2) whipsawed out
3) whipsawed out
4) plenty of pips
(5 - 10) - assuming one went Long at 5th crossover, in spite of the next crossovers (6,7), that 5th trade would probably still be running by at least 8th crossover whereupon one would have probably been stopped out.
9) possibly +pips
10) whipsawed out
11) - seems to be a profitable trade

So, probably not a great session's trading, but probably up a few pips.

A lot of people keep saying that a strategy doesn't have to be high % winning but that as long as there's enough trending winners vs stopped out losers, then it's a successful strategy.

I've not tried this and don't know whether it'd work. I guess that's why I'm here. If I knew, I guess I wouldn't be sitting on forums trying to work this stuff out.
 
Last edited:
You don't get consolidation only outside of trading periods. The real driver for this market is economic indicators which have varying degree of importance. An example of a high impact release is employment and the run up to that can be a quiet period. The chop can exist across sessions and last several sessions
 
Hi asimpleplan,
You'd do well to take forker's comments on board as they are 100% spot on. Indeed, I'd be extremely surprised if any experienced trader said anything very different.

This then leaves you with the same problem that every single trader that's ever tried using an indicator like MACD has to figure out. Namely, when to use it - or 'listen' to it - and when to ignore it. In other words, you need a way of determining when the market is range bound and when it's trending. If you can't do that, then MACD (and many other similar indicators) will we of little or no use to you.
Tim.
 
Back Test

I ran a back test for you. Positions are closed when the MACD crosses back over the Signal. I've assumed a 1 point spread and given you £2000 initial captial. The system only takes trades between 0700 and 1000. Hope this helps.
 

Attachments

  • GBPUSDMACDx1.png
    GBPUSDMACDx1.png
    240 KB · Views: 253
  • GBPUSDMACDx2.png
    GBPUSDMACDx2.png
    184.2 KB · Views: 339
What about adding more rules like:

- add price action bars: at the MACD crossover, add the condition of one candle followed by a bullish/bearish engulfing candle for a trade? I'd wager that very often that engulfing candle and the MACD crossover would more or less coincide! Furthermore, the more range (longer) in the engulfing candle, the greater the potentiality for a trend, right?

- take 5 pips and exit. Obviously, adding that rule would take one out of the longer trends and so I guess I'd need more indicators.

As long as your not playing with real money it can't do you any harm to try out all these ideas - go for it(y)
 
What about adding more rules like:

- add price action bars: at the MACD crossover, add the condition of one candle followed by a bullish/bearish engulfing candle for a trade? I'd wager that very often that engulfing candle and the MACD crossover would more or less coincide! Furthermore, the more range (longer) in the engulfing candle, the greater the potentiality for a trend, right?

- take 5 pips and exit. Obviously, adding that rule would take one out of the longer trends and so I guess I'd need more indicators.

what about this: take half off @5pips and let rest ride. if trade comes right back to entry get out even on other half.:smart:
 
I understand the fundamentals are what drive the market but it's easier for me to interpret a chart than listen to Yellen. At least that's what I used to think..

When I first started reading about trading, I tried to only focus on charts, price action and indicators and sought to develop strategies based solely on those so as to take the emotion and second guessing out of the picture; my point is one'd go crazy trying to keep up with every single news announcement that'd impact the charts.

Anyway, it's a learning curve..
 
news will skew that MACD. always must be cognizant of impending news imo
 
Top