What Really Turned My Trading Around

LLT

Junior member
Messages
22
Likes
0
Trading has became so easy for me nowadays.

Yet looking back, it was a really hard journey. 4 years. Only a few did. What a journey. I wish to share my success with other traders, since I do not wish them to go through what I went through.

I started with FX. Got a few newbie runs with good profit, then thought I was god. And failed horribly. Got really scared. So, I decided to be a true student of the craft.

I tried everything I could find. Everything. The only thing I did not do is to pay for and attend a FX course, since I’ve always believed most of them are quite BS. I needed help, but I could not find the right person to help me. I didn’t know who to look for at all. So, I had to work on my own.

Later, I met a few extremely successful traders who are willing to help. Some of them saw my work and are interested. I am indeed very grateful for their help, but I also knew I still had to work something out on my own. It’s like a father teaching a son how to fish, but the son eventually, one day, has to go out there and stand up on his own.

The only advantage that I have is programming skills I attained as a software developer. So, with that, I started to work and research even more, creating many indicators. Not many survived the test of time.

I figured if I cannot even trade with small amounts with micro accounts, then I can’t be qualified to trade larger amounts, so at the 2nd year, I went live, with $25. My basic goal is to keep the account alive and intact with $25 within the week. But I kept blowing it. So I reloaded and tried again. It was till I hit upon something. And that $25 account survived for the week. I was doing something right and I quickly set my heart onto identifying what is going on.

So I was lucky not to lose too much money. I am now almost hitting the black and into green in terms of my short but intense trading career. But certainly I am very happy to see my trading log today. Red red red green red red…. To green green green green green red green.

I no longer trade FX much nowadays, since I find trading Crude Oil and Gold much more attuned to my personality. But it doesn’t mean the strategy / system that I have here will not work for FX. It does, since I started from FX and created this system from there.

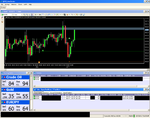
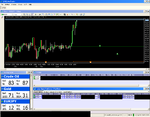
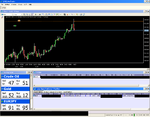
I hope I did not to bore anyone with my story. So I am going to show some screenshots for my maiden thread here in this forum. Pictures speak for themselves and are indeed louder than words.

Please do post questions. Questions will help everyone to learn faster, since its more objective. Even stupid questions can actually bring about important issues we had never thought about. I do not believe in spoonfeeding, since most traders I’ve encountered seem to already have some idea of what they are doing. So questions are the better way.

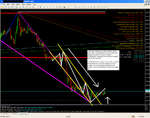
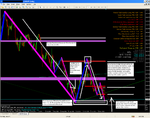
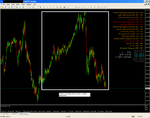
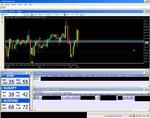
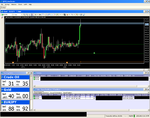
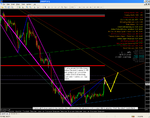
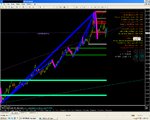
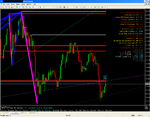
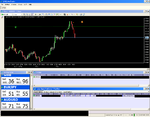
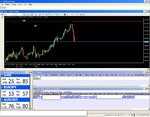
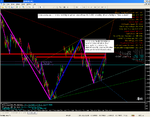
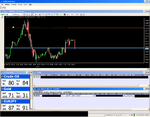
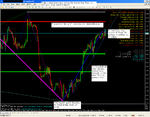
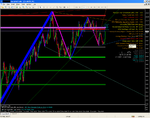
What do you see in this chart? BTW, this is a Crude Oil trade entry of a recent trade, which I took profit off just now. Quite a routine one IMO, to take 400 pips profit off it eventually. It was worth the wait.

Yup, what do you see in this chart? Would love to know what do you guys see. I am still learning myself, but I know this system does work very well. But I would like some feedback too.
 

Attachments

  • 15oarll.jpg.png
    15oarll.jpg.png
    182.8 KB · Views: 508
  • i6w2eo.jpg.png
    i6w2eo.jpg.png
    198.6 KB · Views: 417
  • 351hkcx.jpg.png
    351hkcx.jpg.png
    201.4 KB · Views: 435
Last edited by a moderator:
Hi LLT,

Its good to see you've turned it around and it shows only risking $25 my god who let you open an account with that amount! :)

Anyway, I am in my first year of trading and struggling like most do. I wanted to ask if you could possible list as many things TO STAY AWAY FROM in this industry and things you feel have helped you the most? Also, is trading so simple like spotting ABC 123 patterns with price action along with good risk management and psychology?

I see Support and Resistance lines along with trend lines and zig zags and looks like a fib retracement to 61.8%

Does the news on mt4 update in real time?

Thanks.
 
I took a EURJPY long position yesterday. Very nice, the position is still alive. Now, since I have the time, I will explain whats going on :
Update : 1 of the lots got its SL nicked. Its ok => We still have the other one surviving. Lets see.
 

Attachments

  • 4.png
    4.png
    194.1 KB · Views: 342
  • 3.png
    3.png
    214.2 KB · Views: 420
  • 2.png
    2.png
    214.2 KB · Views: 412
  • 1.png
    1.png
    130.1 KB · Views: 417
Last edited by a moderator:
Hi LLT,

Its good to see you've turned it around and it shows only risking $25 my god who let you open an account with that amount! :)

Anyway, I am in my first year of trading and struggling like most do. I wanted to ask if you could possible list as many things TO STAY AWAY FROM in this industry and things you feel have helped you the most? Also, is trading so simple like spotting ABC 123 patterns with price action along with good risk management and psychology?

I see Support and Resistance lines along with trend lines and zig zags and looks like a fib retracement to 61.8%

Does the news on mt4 update in real time?

Thanks.

Thank you for your compliments!

FXCM Micro had a limited time offer to open $25 micro accounts 2-3 years back. I took it.

I don't know what you exactly mean by 'stay away'. What I can see is that stay away if 1-you do not know what are you doing and 2-you do not know the real nature of the instrument are you trading on.

There are so many things that have helped me with. I am still learning myself. But I think the most important is that learning to trade well is caught, not taught. So if you can find someone to learn from, do it. Ask lots of questions. Drain the person's brain as much as you can.

Trading is simple, but difficult to execute / plan for. Good risk management and psychology matters, yes. Spotting ABC 123 patterns.... well, I've learnt not to trust too much in patterns like those.

The news updates on time yes. Its from ForexFactory. Plot News indicator (version 3.0)

1- Support and Resistance lines - yes
2- Trend lines - yes
3- ZigZags - yes
4- Fib Retracement to 61.8% - not really, it shows up but its not important IMO

Heres my question :
How do you define 1, 2 and 3?
 
Last edited:
The initial position is still alive. I've added another lot to this 'winner'. Gonna lose nothing again since using profit from a quick scalp as a pin cushion/buffer. See you next week!
 

Attachments

  • 12.png
    12.png
    199.2 KB · Views: 354
Last edited by a moderator:
Not bad. The position survived over the weekend and even earned abit of Carry Trade interest. Lets see what happens. Its been 4 days and counting (including weekend).
 

Attachments

  • 23.png
    23.png
    201.1 KB · Views: 429
Last edited by a moderator:
I came home with a surprise. Should I take profit? HMMMM!

Nah. I have time to sit.
 

Attachments

  • 34.png
    34.png
    204 KB · Views: 340
Last edited by a moderator:
Hmm
 

Attachments

  • 45.png
    45.png
    202.1 KB · Views: 316
Last edited by a moderator:
hey dude

good luck with the thread

how did you get the news on the chart ?.......COOL !!!!

N
 
All right. Enough play. Taking the profit =>
 

Attachments

  • eurjpy taken profit.PNG
    eurjpy taken profit.PNG
    76.6 KB · Views: 386
Trying to short gold live now. Gold is :
+ at the daily high
+ retraced a certain amount
+ trying to bounce off a line in the sand my indicator drew automatically
+ try to return from an oversold position to the quarterly trend channel my indicator drew automatically (again)

Pretty fun. Sometimes I wonder if I should release this indicator and everyone will be starting to rob the banks? Or it is just me, the trader that is making the difference? Or both? Is it luck? I don't know sometimes. Really.
 

Attachments

  • gold short zoom out daily.PNG
    gold short zoom out daily.PNG
    80.3 KB · Views: 313
  • gold short zoom in daily.PNG
    gold short zoom in daily.PNG
    70.3 KB · Views: 391
  • AVAFX gold entry.PNG
    AVAFX gold entry.PNG
    72.5 KB · Views: 491
So I decided to take profit off shorting gold. I also had a short AUDUSD running. The profit from gold will act as a stop loss buffer so that my capital loses nothing. Lets see.
 

Attachments

  • audusd taken.PNG
    audusd taken.PNG
    72.6 KB · Views: 331
  • gold profit.PNG
    gold profit.PNG
    74.9 KB · Views: 358
  • audusd chart.PNG
    audusd chart.PNG
    92.4 KB · Views: 378
Not feeling well today. And the year is ending soon. Decided to close the position. In profit anyway.
 

Attachments

  • audusd taken.PNG
    audusd taken.PNG
    73.7 KB · Views: 344
Just some doing some self reflection on a quiet friday night.

I am going to talk about a very contraversial and difficult topic. Regarding indicators. A lot of the thoughts here are both my reflections + research + experience creating indicators.

There are 2 types of indicators :
Measuring / Direct Indicators
Derivative / Indirect Indicators

Most indicators will work using these 4 types of data :
Price - height
Time - width
Speed - slant
Volume - depth

Although one might see some kind of physics here, its not. It looks like it, but we have to remind ourselves that the market is just a reflection what other people are thinking.

Speed / slant may look like a indirect measure. Its not. Think about a tick data chart. What you see immediately? Price moves up and down all the time, but always in a certain slanted angle.

Also I am assuming its hard to get good volume data, since good volume data requires good tick data, so thats leave the topic of volume out for now.

So we all know most of us can't get good quality tick data. So our next best is candlestick charts.

Part 1 of 3 - Stuart McPhee's Interview with Ray Barros - YouTube

Frankly, candlesticks itself are indicators already, since they compress price into certain sets of time. This alone actually makes it a derivative. But its not that bad actually. M1/M5/M15/M30/H1 are still quite ok. We can still treat these timeframes like ticks. Just compressed ticks (LOL). An hour is an hour. Can't argue with that. The problem starts from H2 onwards. Timezones make a hell of a mess of everything. You won't know if the data real enough or not, since we want to have a good measure of what the entire world is thinking. The chart has to reflect it as much as possible.

But alas, even though we have all the H1 candle data we need, we still need someway to string them up together. Candlestick reading is a good attempt, but frankly, its not perfect enough. In fact, if you study the art of candlestick reading and its origins (read Felipe Tudela's book), you will find that the key to candlesticks has nothing to do with the candlestick itself, but understanding how price moves in waves 1st! This reminds us of the perfect tick chart.

So knowing how price moves in waves (at least on the technical side... we have not gone into psychology yet) is considered fundamental.

High and Low. Nothing else. Ignore the open or close for now. If you want to trade, buy low and sell high, right? Right. So what happened? Is trading really that hard that we must confuse ourselves?

Therefore indicators IMO, should do the following :
1- Correct technical charting problems; all the complaints I had stated above
2- Magnify important price movement ; how high and how low and how fast
3- Gather statistics based of time and price
4- Help the trader observe and find edges that concide with market reality faster and better

So all Measuring / Direct Indicators should qualify on these 4 terms, no more, no less.

After we 'correct' these issues and put them aside, the rest is really all in your head psychology. So many traders just cannot get past this. Thats why I said MT4 or most major charting software are created with the broker in mind, not the trader. If it is created for the trader in mind, there will be no business. Think about it!

I hate this personally, as it is a way to create losers in the markets. Most markets are zero sum. So if you can 'popularize' some kind of indicator, you will know there weaknesses immediately. This is why I don't use those common MAs and MACD and stuff. Not even pivot points.

These are Derivative / Indirect Indicators. These indicators distort reality and serve to distract the uninformed trader. False and incorrect information, in any war, creates weaknesses. In the trading war game, in order to win, you look for weaknesses. And press ahead for the win. Or better, create the weaknesses and expliot them and see them drop like flies.

Now, we can argue all day about successful traders using certain indicators like MA and earning a ton of money. My counter arguement would always be : what if the market changes? The most common type of change, at least technically speaking, would be changes in voliatlity. Would the indicator reflect and warn the trader of the change?

FYI if we talk about changes in voliatlity on the psychological side, it would mean stuff like bank interventions, market makers pushing price in certain directions deliberately, fear raising in public sentiment... etc

However, there are certain Derivative / Indirect Indicators that are considered acceptable. These Derivative / Indirect Indicators look for inhernited weaknesses of the market due to its nature and structure. Thats another topic altogether.
 
Hi LLT

Thanks for sharing your story.
In the 4 years have you tried many brokers and different trading platforms?
I saw you are using a couple of different ones.
What is the reason for this?

I'm new to FX and unlike you I actually did a course because I wanted to get into it and not lose my shirt :) ( I actually paid a lof of $ for this course :eek:)
I started trading live this week and as you can imagine I made heaps of mistakes but I'm up 10% (probably just luck)

I use :
AVAFX as my broker and do entries via the trading platform.
AVAFX and IBFX for charting.

2 main reasons why I mix abit :
1- Just to make sure my live account broker doesn't spike me with fake quotes, when comparing with another broker
2- IBFX MT4 platform offers me more candle data so that I can check certain things with my indicators better

Hmmm luck... I don't know. Just be conservative and be patient. Don't be in rush to make money. Opportunities are always everywhere and all the time. Take your time to learn. Plan your life (yes lol). The 1st key is always minimizing mistakes, yes, you are right. Then profit will drop in anyway.
 
LLT
thanks for the reply and the advice.
I'm taking it easy :)
How liquid are commodities?
Is it like FX?
Are there always buyers when you want to sell?
 
Pretty liquid. But do watch out for higher volatility. It can work for and against you.
 
Top