I'm feeling parabolic

FetteredChinos

Veteren member
Messages
3,897
Likes
40
Give me Gin and Tonic......


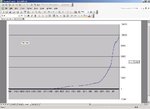
equity curve since 1928 (i think Brambs was trading back in those days)


need to verify things to make sure im not doing something spectacularly hideous, even by my standards.


will post the system rules later..

feel free to subscribe to my signals alerts service. only $650 per month. tea and e-biscuits included..


FC
 

Attachments

  • parabolic.jpg
    parabolic.jpg
    75 KB · Views: 614
ok, Da Roolz.....

tis an intraday counter trend system, attempting to pick tops and bottoms without ending up with pooey fingers....

ive checked the coding and it appears to be sound. but then again i could be missing all manner of things, as it has been a long day..

how do we define our sell and buy levels..

simple.

divide yesterday's high by the high the day before... call this X
divide yesterday's low by the low the day before... call this Y

now. multiply yesterdays high by Y, and yesterdays low by X

these are your levels..

enter the orders at the close of the day (or as near as)

orders remain open for the entirety of tomorrow and close on tomorrows close...


worked example..

14th december, levels were 10730 and 10582.

actual low was 10571 on the cash index, so buy was hit..

close on 14th december was 10676..

10676-10582 = 94 points thankyou very much..

since we are going counter-trend. out of hours activity if anything will assist us.


verification of coding would be appreciated...

would be a shame if this was a balls up..

20pts per day over 5000 trades seems useful.


now, where do i go about posting live profiles?

fc


ps, as always. hit F9 to recalculate the excel workbook if you make any changes..
 

Attachments

  • publication.xls
    1.7 MB · Views: 777
im seriously worried that all is not well with this spreadsheet. it looks too good to be true...
 
I take it this is for DJIA.
Also when you say these are levels, I take it Y*X is sell level and X*Y is buy level?
 
FC

well done. worth investigating.

i want to backtest on the ftse, but when i import data (date OHLC) from my quote vendor into excel the oldest date is at the top and the latest date is at the bottom. how do i flip the columns upside down, but maintain the rows?

(apologies if i don't respond soon. it's my birthday and a few sherbets in the local hostelry is next on the agenda)
 
FetteredChinos said:
enter the orders at the close of the day (or as near as)
You mean, presumably, orders to sell at the higher figure and buy at the lower one?

It certainly does look too good to be true. (But we're getting used to that around here ...).

Hmmm ... interesting ...

Have you had a chance to look at anything other than the Dow yet?
 
I haven't gone through the spread sheet in any detail, but I see that for some days you make a profit from both a short and a long. Your rules say close the trade at tomorrow's close in which case only one or the other can be in profit (I think).

I'll keep looking to spot the flaw in my thinking...

pogle
 
dont worry guys... it was too good to be true..

dodgy data issues

balls..

i knew having 20 spreadsheets of data was a bad idea. i really should just delete this batch for good.

the problem is that it is the yahoo data, and unless they have changed things, the figures for the highs and lows are way out of kilter. check the recent days for proof. i dont think it traded near those levels..

curses..

i will test it with data i know to be accurate tomorrow. perhaps someone could try it on their data in the meantime?


apologies for the balls up.

it is xmas you know, and hangovers are allowed, n'est-ce pas?

:(

fc
 
I only have EOD DOW data from downloadquotes.com (1st Jan '98 - to date) which i've heard is clean. Here's the sheet....hoping someone will spot an error that reverses the equity curve.
 

Attachments

  • FCs Daily DOW Swinger.xls
    701 KB · Views: 586
thanks for looking at this on CC...


i thought as much. from what i have seen before, pretty much buying at any level above the previous close and selling below the previous close and holding to the end of the day results in a net positive system...

eg buy +50pts from the prev close, sell -50pts. keep same levels etc... one acts as the other's stop.

this is why i suspected that things we awry with the sheet as it went counter (!) to everything i had researched before....

i'll keep digging though...but not until next week.. boozy lunch #4 coming up.....

fc
 
Top