Cable & pivot points

Vaco

Senior member
Messages
2,134
Likes
269
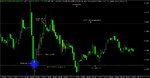
Pivot points is an indicator I always come back to but it is very difficult to view how its performed historically so i am going to use this journal to post a daily chart of cable to show how it has reacted to that days pivot points.

I hope that this will prove useful to anyone wishing to explore their use.

chart will be clean apart from the pivots.

will start with todays chart and update towards the end of the us session.
 

Attachments

  • 6.gif
    6.gif
    40.5 KB · Views: 522
Hope I'm allowed to comment in your TJ. I've been watching how GBP and EUR behave when they are close to the daily pivots. The price does seem to react around these levels. Self-fulfilling prophecy? Maybe, but so is normal support and resistance as well as round numbers. What might be more interesting would be to also mark on your charts areas of major S and R plus round numbers so when the price reacts at a pivot we can definitely discount those important price levels.

The next question is: how to use pivots? I haven't figured out something I'd trust to risk real money with.
 
Your comments are always welcome SW,

AS for discounting pivots if they coincide with other forms of TA,

Thats not the route i want to take, if anything i would hope that at least one of the pivots would be close to a support/resistance line that i would draw in.

I have not started trading off of pivots either but when i have a months + of charts i can go through them looking for patterns that i might be able to exploit, divise a trading plan and then forward test it.
 
Have you looked at different types of pivots such as Camarilla and De-mark as well as floor ? I have several that I monitor as well as weekly and monthly. Sometimes you get price approaching a support level which is close to a resistance level on another time frame. I tend to go more for support / resistance on either MTF or multi-type as being the best scenario. I can post a screenshot if anyone is interested.


Paul
 
Pivot Points

I use them on all pairs that I follow.

They help me stay in a trade once S or R gets broken. Also, it's quite uncanny how many times price will bounce off. I know that many of the big players use them in their
trading set ups. It could well be a case of self-fulfilling prophecy!!
 
Have you looked at different types of pivots such as Camarilla and De-mark as well as floor ? I have several that I monitor as well as weekly and monthly. Sometimes you get price approaching a support level which is close to a resistance level on another time frame. I tend to go more for support / resistance on either MTF or multi-type as being the best scenario. I can post a screenshot if anyone is interested.


Paul

Paul pls feel free to post charts,

As for other types of pivots, If i find an indicator that automaticlly draws them in for me on mt4 i will add.
 
Here is an example of a trade on Friday the set up is as follows:

1) The market opened above the Floor Pivot Point so I was looking for a set up to go Long.

2) Candle A gave this set up when it spiked down through the Floor Pivot Point and closed above it. It was nearly a pin bar and although it wasn’t the candle formation showed that selling was probably exhausted and that there was sufficient support around the Pivot Point to consider a Long position at 1 pip above the high of candle A. The risk was 13 pips and a stop would be taken if the price went below the Pivot Point.

3) Target was the R3 “Short” Camarilla Pivot as shown and as the reward was better than 1:1 it was worth the risk

4) Target was hit as shown for a profit of 32 pips. More could have been taken but when intra-day trading it is better to have clear targets in my view.

Note how the combination of using Floor Pivots and Camarilla Pivots along with price action gave a nice trade.

I am alerted to opportunities as shown in the second screen shot where I have three different pivot types across daily, weekly and monthly time frames.


Paul
 

Attachments

  • eu.jpg
    eu.jpg
    102.7 KB · Views: 923
  • rs.jpg
    rs.jpg
    193 KB · Views: 550
Here is an example of a trade on Friday the set up is as follows:

1) The market opened above the Floor Pivot Point so I was looking for a set up to go Long.

2) Candle A gave this set up when it spiked down through the Floor Pivot Point and closed above it. It was nearly a pin bar and although it wasn’t the candle formation showed that selling was probably exhausted and that there was sufficient support around the Pivot Point to consider a Long position at 1 pip above the high of candle A. The risk was 13 pips and a stop would be taken if the price went below the Pivot Point.

3) Target was the R3 “Short” Camarilla Pivot as shown and as the reward was better than 1:1 it was worth the risk


Paul,
If you don't mind could tell us how camarilla pivots are different from the the ones normally used

4) Target was hit as shown for a profit of 32 pips. More could have been taken but when intra-day trading it is better to have clear targets in my view.

Note how the combination of using Floor Pivots and Camarilla Pivots along with price action gave a nice trade.

I am alerted to opportunities as shown in the second screen shot where I have three different pivot types across daily, weekly and monthly time frames.


Paul

Paul,
could you please explain how camarilla are different?
 
Paul,
could you please explain how camarilla are different?

Cams are calculated differently and the result is that you have 3 levels of Resistance and 3 levels of support but no pivot point in the middle.
 
Auto pivot point calculators for mt4 attached. Hope they come in useful for anyone interested.
Regards Alan.
 

Attachments

  • BucPivot_V1.2_Day.mq4
    7.7 KB · Views: 318
  • BucPivot_V1.2_Month.mq4
    7.7 KB · Views: 295
  • BucPivot_V1.2_Week.mq4
    7.7 KB · Views: 318
Cams are calculated differently and the result is that you have 3 levels of Resistance and 3 levels of support but no pivot point in the middle.


Thanks for that,
Is there any reason as why there is middle pivot
 
This has been answered by Elefteros so I presume I don't need to add anything.


Paul

My Camarillas have 4s & 4R levels*, plus a central PP, which is the same as the FTP one, so in Paul's earlier example, the Long trigger could just as easily have been labelled Camarilla PP

* but it should be noted that most practitioners don't pay too much heed to the R1, R2 and S1 & S2, preferring to use 3 & 4


R4 = C + RANGE * 1.1/2
R3 = C + RANGE * 1.1/4
R2 = C + RANGE * 1.1/6
R1 = C + RANGE * 1.1/12
PP = (HIGH + LOW + CLOSE) / 3
S1 = C - RANGE * 1.1/12
S2 = C - RANGE * 1.1/6
S3 = C - RANGE * 1.1/4
S4 = C - RANGE * 1.1/2
 
I also have the Camarilla breakout pivots plotted as well but they are not visible on the previous attached chart as the price was not near to them. My approach is very similar to that of R_E with minor variations that suit my style.


Paul
 
knowing when to get out will be the key to any pivot stratagy imho.
 
Question, for those already trading pivots aka paul, rath.

How many bites at the cherry do you take if the first reversal whips back to make another low and stops you out?
 
in theory, I have no limit on bites - eventually price will either prove you right or move away enough to stop false triggers.
but in practice, if i get stopped out 4 or 5 times, I tend to widen my entry points based on this new recent period of consolidation.
 
I've added the cam pivots on today's chart however they are not labbeled.

Today was again another good example of price bouncing off of pivots.
 

Attachments

  • 7.gif
    7.gif
    44.7 KB · Views: 233
check out Cams on ES - Long off 1027.50 Weekly
then again Long off 1034.50 Daily
then again Long off 1043 Daily waiting for a Reversal Short from 1047 Weekly

:)
 
Top