Breakout Trading using Time and Sales

amit1986

Experienced member
Messages
1,100
Likes
66
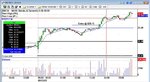
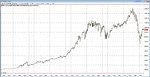
This is one of the trades I took today, BRCM.

There was clearly strong resistance at the $30 decade number. As the stock broke out at 1:40pm EST, it did so with strong force, as evidenced by the Time and Sales. Usually, stocks that break strong areas of support/resistance come back to re-test those areas. I waited for this re-test, and it was clear previous resistance had now become support. Once the 1:45pm candle broke the prior candle's high and Time and Sales confirmed my entry, I got an entry at $30.10. To add further to this high-probability trade, the NASDAQ 100 E-mini futures had broken their previous days high with strong conviction.

Exit was at $30.35 (as can be seen on the chart on the red cross hairs) due to massive selling pressure on the Time and Sales, or one could have trailed the stop using the EMA(10), which would have provided an exit at $30.36.

If trading 500 shares, this would have yielded $125; if trading 1000 shares, this would have yielded $250. Not bad for about 20 minutes in the market.

Thanks for reading! :)
 

Attachments

  • BRCM.jpg
    BRCM.jpg
    83.9 KB · Views: 2,420
The Limitations of Time and Sales:

While Time and Sales does add significantly to the probability of a trade working out, it should always be used relative to the stock being traded. For most people with relatively little experience in tape reading, Time and Sales can appear to send the wrong message for stocks that trade with high volume on an everyday basis. An example of this includes stocks such as MSFT, ORCL, and MGM.

Generally speaking, stocks that average 30 - 50 million shares everyday should be avoided as their message on the Time and Sales screen can be misleading. You may see 20 large orders go through at the bid, but this may not mean that the stock has enough momentum to confirm a breakout.

An example of one of my trades today was MGM. Prior to entry, the stock was displaying a clean, trending chart. Time and Sales showed very strong buying pressure, with large orders being hit at the ask. Momentum was clearly there. I took an entry at $12.15, watched it shoot up to $12.23, and then saw similar selling pressure building up. As price fell, I was quick to get out at breakeven on this trade, losing only the commissions (which does not come out to be much with a broker such as Interactive Brokers).

MGM then continued to break again 10 minutes later with similar momentum, but then reversed. As I watched the Time and Sales, I noted that almost every trade that went through was a large trade. In fact, it was rare to see trades less than 3000 or 4000 shares in size.

Prior to taking a trade, it can be useful to see the average daily volume over the last couple of weeks on a stock from websites such as Yahoo! Finance - Business Finance, Stock Market, Quotes, News.

Lesson: Avoid stocks that trade on very high volume. Stick to stocks that trade less than 10 - 15 million shares on average per day.
 

Attachments

  • MGM.jpg
    MGM.jpg
    85.9 KB · Views: 1,118
"Time and Sales showed very strong buying pressure, with large orders being hit at the ask. Momentum was clearly there. "

good trae by the looks of it, but my question is that why would you go long at a breakout whenever large asks are getting hit- couldn't this be the stop losses from shorts as there seems to be some resistance at 12.15 ?
 
Hi,

Occasionally, as prices do break areas of important support/resistance, stops are hit. An example of this is the previous day high and low prices. Traders usually place stops a cent or two above (previous days high) or below (previous days low) in the event these areas are penetrated. So, if you take a long after the price breaks above yesterdays high, for example, the stops that get hit by those who have placed stops at that area will add further buying pressure to the price. This will act to drive the price higher.

Hope this helps!


"Time and Sales showed very strong buying pressure, with large orders being hit at the ask. Momentum was clearly there. "

good trae by the looks of it, but my question is that why would you go long at a breakout whenever large asks are getting hit- couldn't this be the stop losses from shorts as there seems to be some resistance at 12.15 ?
 
ya i know what you are saying but my point is how do you know if a breakout is genuinely real or whether it is just being temporarily driven by stop losses! i mean if you knew where stops are being hidden you could just place a buy/sell stop to scalp a few cents .

But from what i can see it seems as if you are following trend days and taking little bits out of them rather than scalping small breakouts so this isn't really an issue :)
 
Hi,

Unfortunately, you can never know for certain whether a breakout will be genuine. Most of the time, a breakout may be not confirmed as a "genuine" breakout from reading the tape and it may be a false breakout (aka, a fakeout). The best thing to do is to follow the rules and take an entry whenever you justify a breakout but if it reverses and goes against you, be quick to get out with as small a loss as possible.

There are other cases, though, when a breakout doesn't have enough momentum behind it, but still continues for several cents in the breakout's direction.

Scalpers usually have a different perspective when reading Time and Sales since their objective is to get in and out as fast as possible. I usually like to ride the entire wave :).


ya i know what you are saying but my point is how do you know if a breakout is genuinely real or whether it is just being temporarily driven by stop losses! i mean if you knew where stops are being hidden you could just place a buy/sell stop to scalp a few cents .

But from what i can see it seems as if you are following trend days and taking little bits out of them rather than scalping small breakouts so this isn't really an issue :)
 
Hi,

Sorry for the delay - just been a little busy. Anyhow, here's another trade I took on Friday October 2, 2009.

Usually, I would have avoided this set up because it already had a nice move up without any consolidation for the first half-hour of the market. However, if you glance at the 3rd 5-minute candle, you'd notice it was a doji. That doji occurred at the $26 whole number, which was expected since whole numbers act as automatic support/resistance. But the stock didn't stall for long, as the next candle was strongly bullish.

At the 10am candle, there were a couple of off-chart indicators that confirmed my entry into this long-trade. First, at the time of entry, the ES chart (E-mini S&P 500 futures) had made new highs (I have attached a picture of this chart as well). This helped push my BBT trade higher. Second, Time and Sales displayed some momentum. Although Time and Sales was not perfect (the speed of the trades was not very fast), there was a lot of buying pressure and price was flying through the ask prices. It did break out a few cents at first, however I did not enter. But when Time and Sales started to pick up pace, I entered on clear momentum.

I took half my position of at the next candle at $26.68. The stock was having trouble around this area. If you look at the ES chart, you'll notice that the 10:05 candle was bearish and that's what could have been holding BBT back. Finally, as the ES futures broke out to new highs, my BBT trade also made new highs. My target for the stock was the 27.00 dollar whole number. It penetrated right through the whole number and continued going up, but the next candle started displayed strong selling pressure on the Time and Sales (you can also see this on the volume bars) and I was quick to close out my position at $26.96.

If trading 1000 shares, this would have produced a profit of $351.35; if trading 500 shares, this would have produced $175.675.
 

Attachments

  • BBT.jpg
    BBT.jpg
    91.4 KB · Views: 983
  • ES Chart.jpg
    ES Chart.jpg
    74.8 KB · Views: 749
good stuff. I looked at T&S of a few stocks the other day and i have to say it is a LOT easier to read than on the ES. At the moment i have a few soild price action setups and methodologies, i pay attention to higher highs/lows and consolidation patterns and stuff like that.
Just a thought though i was thinking that if a stock is in a trend day you could enter a pullback with price action, or you could look at time and sales and look for weakness in strength etc (in a downtrend).

Strange how much easier stocks are to read the tape on :)
When did you start tape reading?
 
Hi,

In my opinion, reading time and sales on pullbacks can be very tricky. It's best to trade pullbacks based on patterns (for example, ascending/descending triangles) and watch time and sales to see if others are trading those patterns. However, when trading pattern charts, I rarely make Time and Sales as my sole reason to enter. This is best left for the afternoon session of the market though. I started tape reading about 2 years ago.

good stuff. I looked at T&S of a few stocks the other day and i have to say it is a LOT easier to read than on the ES. At the moment i have a few soild price action setups and methodologies, i pay attention to higher highs/lows and consolidation patterns and stuff like that.
Just a thought though i was thinking that if a stock is in a trend day you could enter a pullback with price action, or you could look at time and sales and look for weakness in strength etc (in a downtrend).

Strange how much easier stocks are to read the tape on :)
When did you start tape reading?
 
i heard on elite trader some guy saying that nasdaq and futures tape reading deosn't exist and soon NYSE once it becomes electronic lulz, he's obviously wrong...sorta because i think his style is to follow specialist and MM activity, well how else could the likes of you and folks like mr charts read tape !
 
Interesting point. I'm not sure how people can so quickly dismiss tape reading as a valid trading technique. To be completely honest with you, I think tape reading is probably the most fundamental way of trading there is. Price action of any product is driven by supply and demand, and that is what tape reading is all about - identifying areas of supply and demand. Of course it's really not as simple as seeing a lot of buying/selling pressure and trading off of that, but over time, you tend to figure out what to look for when reading the tape.

Plus, I wouldn't put Mr Charts and myself side-by-side. Mr Charts is a seasoned professional at this game, while I still consider myself in the "learning" stage. :)


i heard on elite trader some guy saying that nasdaq and futures tape reading deosn't exist and soon NYSE once it becomes electronic lulz, he's obviously wrong...sorta because i think his style is to follow specialist and MM activity, well how else could the likes of you and folks like mr charts read tape !
 
yeh found out that guy reads the quote of level 1 and doesn't even read T&S, he looks for a big buyer and follows him, seems very complex tbh and he says when NYSE goes fully electronic it will be impossible to do it like that again. but you can always rely on T&S
 
i can't help but bullsh*t on forums, i got caught out again, i can't look at T&s on stocks with my demo , lol how embarassing
 
Head and Shoulders Pattern on Dow Jones Industrial Average

Seems to be the formation of a Head and Shoulders pattern on DJIA!

Interesting to see how it plays out.
 

Attachments

  • DJIA-H&S.jpg
    DJIA-H&S.jpg
    239.8 KB · Views: 710
I love how you explain your topics.
So informative and I get it!
Read it last night and today as well..but yes I got it
:clap:
Yes...also don't disappear again!
 
Top