HammerMan Exposed

HammerMan87

Junior member
Messages
38
Likes
0
Hi All,

During the next 3-4 weeks I will be following a strategy I have developed and I am inviting you all to follow along - read my thoughts, look at my trades, comment on my strategy and approach and just generally watch someone in action.

I will record the setups to each of my trades and post my exits, I will also endevour to post the trades I didn't take for whatever reason. I will also upload my excel trading journal after every trade and a daily equity curve.

As I will be posting a lot of material I have started another thread "HammerMan Exposed Comments". Please post all of your questions and comments here as this will allow everyone to follow my trades and thoughts in chronological order without comments and questions interupting up the timeline.

I am doing this to develop my discipline and hope to inspire others to follow a regimented trading routine and hopefully make some money.

I will start trading on Monday the 25th of May.

I have uploaded my "blank" trading journal for you to look at. It will obviously be filled in as I go and updated with the date in the file name. It includes the strategy I will be following, a record of each trade, an open position tracker, and an equity curve.

Regards,

HammerMan
 

Attachments

  • FX Trading Log.xls
    144.5 KB · Views: 482
Last edited:
Ok, It's Monday morning - time to start looking for opportunities. I have $1183.00 AUD in my accont and will be risking roughly $100 or less per trade. this way I will only go broke if I am wrong 12-15 times in a row. Not impossible although improbable.

First Opportunity to arise. NZD/USD

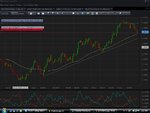
4 Hour Chart - +DMI is showing strength as per the uptrend line on the indicator and the 60p MA is still trending up. looking to go long.

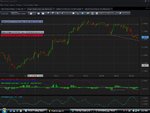
1 Hour Chart - the MACD histogram is showing weakness. looking for an entry.

15 Min Chart - I have place a order for 2 contracts to go long. Limit order at the previous significant high for 1 contract with an atr trailing stoploss on both.

NZDUSDh4.jpg

NZDUSDh1.jpg

NZDUSDm15.jpg

Entry target at 0.61875
Stop loss at 0.62330
Pip Risk 37.5
Risk $96.00
 
Also looking the USD/JPY

Reasons.

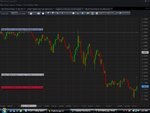
4 Hour Chart - Downtrend still in force as the -DMI is showing strength - as shown by the uptrend line on the indicator. MA is down

1 hour chart is showing positive MACD histogram which is rolling over showing that that retracement is slowing.

15 Min Chart - entry for 2 contracts placed below previous swing low/support - profit target at the previous significant swing low on the hourly. Close one contract at profit target, trail both on an atr stoploss.

USDJPYh4.jpg

USDJPYh1.jpg

USDJPYm15.jpg

Target Entry 94.499
Stop Loss 94.750
Pip risk 25.1
Risk $67.77
 
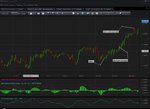
Stopped out of the USD/JPY trade for a 1R loss at my initial stop loss. Please see the below chart. stopped into the NZD/USD trade shortly after I was stopped out of the JPY trade.
USDJPYexit.jpg
Any Comments? Was this trade well executed?
 

Attachments

  • FX Trading Log 52509.xls
    145 KB · Views: 333
Last edited:
The USD/JPY has formed another setup following my rules.

4 hour chart - 60p MA is down and the -DMI is trending up and showing convergence to the trend. the +DMI is weakening, showing that the downtrend is still in control. Also price has rallied to near the 60p MA which could act as resistance

1 Hour Chart - the MACD has turned positive and is showing bearish divergence. time to place a short entry order.

15m Chart - entry and stop loss below/above swing low/high.

Please see attached charts.

525USDJPYh4.jpg

525USDJPYh1.jpg

525USDJPYm15.jpg

Below is a trade that met my setup criteria but I DIDN'T take because the probability wasn't in my favour

USD/CAD 4 hour chart shows a downtrend with the -DMI showing strength in the downtrend. The 60p MA is trending down.

1 Hour chart shows positive MACD histogram. time to look for an entry.

USDCADh4.jpg

USDCADh1.jpg

I didn't take this trade as the 4 hour chart shows price has extended way below the MA, to me this means that price is possibly oversold and shorting after a long sustained downmove could present a low probability of continuation.
 
Hi Hammerman87, today is a bank/public holiday here in UK (and US too right?). I try to avoid trading on such days, because there is likely to be less movement. If I understood correctly, you are trading with the trend, using some indicators for confirmation. You then enter on a breakout of the last swing or significant high. But I can't really see those highs that you're writing about. Which chart is it a swing point on, 15m, 1hr or 4hr?

Also I didn't understand
Below is a trade that met my setup criteria but I DIDN'T take because the probability wasn't in my favour
Isn't your criteria designed so that the probability is in your favour?
 
The swing point is on the 15m chart and could be described as a recent high/low or support/resistance. just want price to be moving in my direction when i buy. I didn't take the CAD because price was well below the moving average. Price is extended, oversold, - sure it meets the setup criteria but at a point which although may start in the right direction does not have the potential for a bigger move. At lease by my opinion. and if you look at the CAD now it did start to move down again once I identified the setup although it promptly rallied and I would have been stopped out at a loss. The beauty of discretionary methods.
 
Stopped out of the NZD/USD today at 1R. Please see the below chart.
Probably put my stop a little close to the 1H support and so I may have been stopped out prematurely. On the other hand I couldn't of afforded much more risk on the trade as it would have been out of my limits. In future I will look for other, more affordable, opportunities so that I can better place my stop loss.

NZDUSDh1exit.jpg
 
Stopped out of the USD/JPY for a 0.7R loss. followed my rules so I am happy with the trade. not too well overall though as I am 3 for 3 losses so far. Attached is the exit chart.

525USDJPYh1exit.jpg
 
Stopped out of the USD/JPY trade for a 1R loss at my initial stop loss. Please see the below chart. stopped into the NZD/USD trade shortly after I was stopped out of the JPY trade.
View attachment 57318
Any Comments? Was this trade well executed?

the 4 hour chart shows the pair clearly in a Down cycle.

if you look though at the 60 minute chart, price had clearly broken above the short term trend line

i wouldn't have wanted to go Short here until price had dropped to the 94.00 region, to re-affirm the continuation of the downward move

(the 94.00 area being the the end of the invisible line from the 60 minute trend line, as well as nice round number)

but to asnwer your question, was the plan well executed ?
did you have a plan ?
did you stick to your plan ?
was your original Stop based on a careful mathematical calculation of Risk:Reward ?
did you keep your Stop where it was rather than moving it to give yourself more "breathing room" ?
have you learned anything from this experience ?

if the answer to the above questions are all "Yes", then yep that was a trade well planned and executed :)
 
Stopped out of the USD/JPY for a 0.7R loss. followed my rules so I am happy with the trade. not too well overall though as I am 3 for 3 losses so far. Attached is the exit chart.

View attachment 57410

price was in a clear consolidation period, no time for be placing trades.

personally, although i would be a Bear on this Pair longer term, from your charts I would have been looking to go Long once price broke out above 95.70

or even a Short, at that same point but again I would have waited until price had moved out of the consol channel up to somewhere where something was going to happen.
You'll never know what's going to happen, but it's a darn sight better to trade when you know sowmething must happen rather than chuffing along in a poxy channel
 
Ok, Next trade

AUD/USD

4 Hour chart - price is at 3 levels of support, the longer term trend line, the shorter term trend line, and the 60p MA. The -DMI is showing lower successive tops and the +DMI is showing higher successive bottoms, hinting that the up trend is still strong.

1 Hour Chart - showing the MACD histogram recovering towards the reference line and we have a doji at the bottom of a swing low, price is also trading at the bottom of a range.

15min chart - Placed orders, for a break of 7790

AUDUSDh4_1.jpg

AUDUSDh4.jpg

AUDUSDh1.jpg

AUDUSDm15.jpg

Risk 37.8pips
 
EUR/USD Trade setup.

4 Hour Chart - price has tested support at the 60p moving average and is trending up. The +DMI has hit a negative extreme which over the past few months has consistently signalled a change in direction to the upside.

1 Hour Chart - MACD histogram is recovering towards the reference line and is also showing bullish class b divergence. price has traced a lower low but the histrogram has traced a slightly higher low.

15 Chart - entry. Stop placed at an affordable level.

EURUSDh4.jpg

EURUSDh1.jpg

EURUSDm15.jpg
 
Exited the AUDUSD this morning,

Below is the chart, I exited the first contract at the resistance of the old highs and the other at a measured target of the previous swing high to swing low (price distance) added to the old highs. I have also attached an equity curve of the past week, including today.

I still have a 1 contract position in the EUR USD.

AUDUSDh1exit.jpg

Equity curve to 010609.jpg
 
Exited the EURUSD trade aswell. similar reasons to the AUDUSD trade.

Below is the chart.

EURUSDh1exit.jpg

As everything has moved fairly significantly due to US$ weakness I may have to wait a few days before I get another trade signal, hopefully a correction and resumption of the uptrend - until confirmation of a reversal.
 
Due to the USD rally last night many of the pairs have corrected back to support/resistance levels. I am looking at the following pairs.

AUDUSD - Long

4 Hour Chart - Price has his support near the 60p MA and the uptrend line. The -DMI has spiked upwards showing that price could be oversold.

1 Hour Chart - MACD and histogram are rising.

15min Chart - Entry point

Profit Target of recent highs

AUDUSDh4.jpg

AUDUSDh1.jpg

AUDUSDm15.jpg

USDCAD - Short

4 hour Chart - Price has rallied to find resistance at the 60p MA and the +DMI is showing an extreme reading - suggesting that price is overbought. Price shows a clear downtrend

1 Hour Chart - MACD histogram is rolling over.

15 Min Chart - Entry

Profit target at the resistance break of last night.
USDCADh4.jpg
USDCADh1.jpg
USDCADm15.jpg
 
Stopped out of the AUDUSD and USDCAD. below are the charts. started off in the right direction as equity markets rallied in Europe. Below are the charts
USDCADh1exit.jpg

AUDUSDh1exit.jpg

both Losses of 1R
 
Just been looking through some of your entries, and some thoughts for the above 2.

Both of those trades looked to be very counter trend, and I am not suprised they turned out to be losers.

This is particularly apparent in the second screenshot: The down day previously clear has broken a trendline that I would have running under that uptrend, for me indicated a potential end to the uptrend, and then it breaks straight through the support line that you even have on the graph.

So on the standard retest of the broken support, I cannot see why you have gone long into it, when the obvious play is to go short on the retest, which would have worked well.

Clearly I dont have the fib levels, but that looks like it may line up with some fibonacci retracement values.

What was your reasoning for a long trade? My bad if it is listed in previous pages, I didnt look.
 
Thanks for you comments it is much appreciated. The above charts are Hourly charts - time frame for which I manage my trades. The AUD (top chart) hit support on the 4 hour chart for which it bounced and price is in a clear uptrend. Similar with the CAD (except a downtrend). The bounces just weren't sustained. I would sincerely appreciate it if you had a look at my entry posts on page 2 for these trades and see if you agree with my justification. If not please inform as to where I went wrong.
 
Taking the USDCAD short:

My main issue with this applies to the 1 hour and 4 hour charts. Looking at this setup, a legit breakout from a trend, and a VERY strong one too given the previous candles, I just dont think a short is a high enough % play, with a good Risk Reward outcome.
What are our potential outcomes?
1) Blast straight through
2) A minor pullback from the resistance at the 26th/28th of may, before resuming
3) A serious pullback

Clearly, we do not know which one will happen. But the whole point of trading is too put yourself in a position where you should get it right more often than not, and here short defintly is not the way. On a blast through, you get stopped out. For 2), you would get taken out breakeven if you are lucky. 3) You win, IF you can manage it well. But the chance of a move down being 2 or so times your risk? Very low for me.

From the 15 minute chart I can see you intended profit target, of a COMPELTE retracement of the previous breakout, and this just isnt going to happen enough of the time to make the trade a good one, IMHO.

But yeah, Ill admit the 15 does show a pretty looking H&S pattern, and this will work a reasonable amount of the time. But you just cannot enter on this pattern, and then try and manage it on a 1 hour time frame that is so clearly medium term bullish. The only possible chance of you not getting done here is by managing this on the 15 min and being very mindful of the upside.

But overall, the only play here should be a long, IMO. If it doesnt setup and keeps blasting, then invest your money elsewhere, no biggie.
 
Top