wot happens next?

barjon

Legendary member
Messages
10,752
Likes
1,863
Someone suggested that we might try a wot in real time, although this is likely to be a long burn thread since it is a daily chart. The first chart is 3 months worth, the second two years.

The scenario is that you must trade this whether you like it or not. So how would you plan to do it and why. And what would you be looking for in the trade.

Enjoy

jon
 

Attachments

  • wot1.PNG
    wot1.PNG
    19.3 KB · Views: 335
  • wot2.PNG
    wot2.PNG
    21.3 KB · Views: 338
Got to dash but will certainly have a look at this later, could be fun and interesting:clap:
 
This is what will happen. Ideally I'd wait for a move upwards and a lower high to be formed and enter after that with stop just above lower high (first red dot). Then we'll have some bigger moves down with small pullbacks which I would use to place my stops above. So in the next 3 months, I think its going down. Now come on Mr. Marcus, tell me whats really going to happen!

Sam.
 

Attachments

  • wot3.png
    wot3.png
    24.7 KB · Views: 308
In conventional TA terms, price is at a clear support level on the 2 year chart, which may or may not be significant now. Certainly, it's comforting to see for anyone inclined to go long. However, the recent strong bearish move doesn't look set to do a complete U-turn quite yet, although there are signs that the momentum is easing off. There's a little consolidation area where some buying took place, producing a good sized outside green candle, but not quite enough to amount to a dead cat bounce. My guess is that the candle is more likely to be a consequence of short covering, rather than fresh buyers entering the market. The volume bar that day was the lowest one for the entire move down to date, which is not what one might expect - or hope - to see if fresh buyers were being tempted in. The last two candles are accompanied by a significant increase in volume which suggests a possible volume blow off.

Based on this chart, there's no way I'd want to enter short now. That would be like arriving at a party way after midnight when the only booze left is a half drunk bottle of Lambrusco. I'd wait and watch over the next day or two to see how this plays out. My guess is that price will drop a little more - but not much - before starting to retrace. If fresh buyers come in in strength, and the main market is bullish, then the remaining shorts could start to unwind their positions pretty quickly. In these circumstances there could be a reversal back up to the previous swing highs, although this is unlikely to happen in a single, swift move. To mirror the move down is improbable and will require greater and more sustained effort from the bulls than was needed by the bears to cause the price fall.

To conclude, my general bias is bullish and I would plan to go long as soon as there was evidence of buyers coming in, especially if backed by the main market. I'd set stops pretty tight in case the market disagrees with my analysis (it's been known) and the move turns out to be a dead cat bounce. If the move gains some traction, I'd be hopeful of a 50% retrace over the course of the next week or so, before some consolidation and even a small pullback.
Tim.
 
Hi Sam,
You may well be right, but we're gonna have to wait at least until next Christmas or beyond to find out!
:LOL:

:) i said it might be a long burn.

this about right so far? i'll leave stops and targets 'til any trades are triggered

jon
 

Attachments

  • wot3.PNG
    wot3.PNG
    17.3 KB · Views: 308
Hi Jon,
Yeah, I'm happy with that. As I said in my main post, I wouldn't expect price to go all the way back up in a single move so, a consolidation at least - and probably a pullback - around the area Sam would go short is to be expected. In the early stages, he and I are on the same page, I think!
Tim.
 
I see down trend on both charts so I'm bearish.

If ( and only if ) timsk's long is triggered then I'll short if price touches the level of the previous low 25 bars back on the 3 month chart.


dd
 
Last edited:
:whistling I would be inclined to think bearishly if a shorter timeframe, which such a big timeframe it is harder. I would have to wait a little. Interesting though.
 
Those lows on the two year chart are obv from mar 09 so the strong bounce to the top suggests to me it's a stock the market likes. Topped out pretty certainly though so maybe in a troubled industry or some bad news. Can't reach old highs either.
Someone will find some value somewhere around here even if for a short period. Must do after all that choppyness. Swing highs are higher and lows are lower in 3 mnth so I'd be looking for a bit of a long if the chart shows a turn wit htarget to the green bar (3rd back on 3mnth)
 
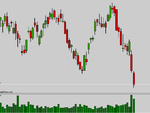
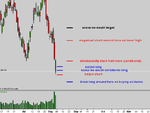
There is definately a current downtrend on the instrument on the t/f shown (I assume both charts posted are the same t/f) ...price has reached an area where a fractal swing low (not yet formed) would constitute a LL after a LH.
532uxj.gif

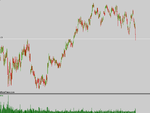
Looking at the bigger picture screenshot - (2years and assuming it is the same t/f) the previous fractal swing hi (= previous resistance = potential RBS) zone circled in black would show up as such on the next higher t/f although it is unlikely that the one circled in red would.
rihvgi.gif

There are 2 pertinent things to note about this potential RBS, they are

a. The previous fractal swing highs are ' non-immediate,' ie they do not form part of an upswing ie a previous swiwng hi in a n upswing/trend that may act as potential RBS if tested in a pullback from the topside.

b. As stated above really only the previous swing hi furthest to the left of the chart would show as fractal swing on the higher t/f.

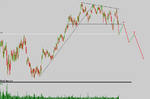
These 2 factors affect the likelhood over any given sample of such a previous point of resistance acting as potential support....In looking to go long from there it would be an outright reversal of the present downtrend on that t/f...and in so doing the question should be whether it is a pulklback in the next higher t/f up trend, which looks like it may not be given the consolidation and downside break that has occurred (shown by the 2 lines on the chart above.)

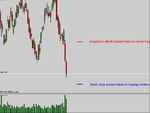
In going long I would be looking for further potential support factors at point d, possibly a fib of move Z-X or Y-X and be looking for regular divergence or oscillator extremes at this level with a very good 'reversal candle or combination therefore suggesting that the upside (howsoever temporary) would be the most likely play from there....ie bounce not break, and this on the t/f below thos one or even on t/f below that that t/f immediately below that shown also having such a supporting set-up develop. Ie In entering long 2 t/f's below that shown I would look to see how the candles closed on the successive t/f's above as to whether price action was confirming such a move higher was more probable.

Should no such set-up present itself or even if it did I would still plot a fib from point f - d and from point g (the LH marked on the 3mth picture) to same point d and be looking for a confluence of reasons to get short again with a hidden divergence set-up on the t/f below this one, suggesting that the rally from point d is a pullback in that t/f's downtrend and that the short trend on this t/f may continue.

G/L
 
Last edited:
ok, I promised to play :cry:

If I was forced to trade on Monday I'd bracket with a long order just above the half way point of the last candle and a short order just under the low of that candle.

The chart shows what people have determined as far as I can tell - hope I've got you right.

jon
 

Attachments

  • wot4.PNG
    wot4.PNG
    20.1 KB · Views: 257
oops, missed out bbmac since he posted whilst i was preparing chart. Never mind, his chart and explanation enables you to add him in.

jon
 
:) i might need it

since we're in real time i suppose there's not much point in hiding the instrument - i just excluded it so people would focus exclusively on the chart.

i suppose, since i'm playing too, that it'd be fairer all round if everyone knew what it was and it'd save me a lot of cutting and pasting.

it's unilever (ulvr)

if anyone makes their trading decision (you have to trade it remember) from anything other than the daily chart then please post up the chart you've used. ta

jon
 
if previous days candle is red i look for shorts on intraday structure. if green look for longs.
 
Top