The Dow - May 23-27 2005

TheBramble

Legendary member
Messages
8,394
Likes
1,170
The Dow is finding Resistance at 10500 (although has been having a go at it) and will find strong Support at 10000 and weaker support at the century levels (and the 64s of course! :cool: ).

It doesn't seem to have the 'strength' to push through and is likely to meander between 10400 and 10500 for the early part of the week, but with an overall tendency to drop toward 10300 by end of the week.

Fire away real Dow Traders.... :rolleyes:
 
TheBramble said:
The Dow is finding Resistance at 10500 (although has been having a go at it) and will find strong Support at 10000 and weaker support at the century levels (and the 64s of course! :cool: ).

It doesn't seem to have the 'strength' to push through and is likely to meander between 10400 and 10500 for the early part of the week, but with an overall tendency to drop toward 10300 by end of the week.

Fire away real Dow Traders.... :rolleyes:


Not a real DOW trader but agree with what you are saying. 10250 or less looks likely before another swing high comes along. I only see moves in days not weeks so where it goes beyond the middle of next week is a question is beyond me until Tuesday ;)

For now there is a reasonable upper lower limit to watch. I have DOW/SPX/FTSE/DAX all topped out from Thursday/Friday. See what Monday brings.
 

Attachments

  • dow1.jpg
    dow1.jpg
    57.2 KB · Views: 379
Kevin, why have you connected the lower trand line as you have.

I'm looking (following your example) at a much lower low point which would hint at 10100, not 10250.

What's the rationale behind they way you've drawn it?
 
TheBramble said:
Kevin, why have you connected the lower trand line as you have.

I'm looking (following your example) at a much lower low point which would hint at 10100, not 10250.

What's the rationale behind they way you've drawn it?

Merely as a heads up on what the likley short term range is. Excluding the spike down to ~10080 there is clearly a symmetry between the two trend lines showing a channel. One of many things I use to plot moves. If 250 was taken out then I would be looking for a move to the bottom of the spike, your 10100 area. If it falls and bounces off 250 it would make sense to me why, just as a move back to the spike down area would mean something.
 
Here are my thoughts.
Analysing long term (1 year) first.
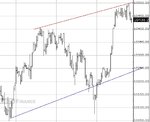
NAS COMP is leading the Dow up. The 1 year NAS Linear Regression and Standard Deviation are slightly up and price is neutral. However, both the 6 and 3 month LR lines are down and, significantly, price has been above the upper SD line for 3 days. Statistically, this means that either the 3/6 month downtrend is over, or price will pull back quickly into the SD channels, which encompass 95% of all data points. The SD lines are at 2014 (6month) and 1995 (3 month) on the NAS Comp.
With the Dow price is only slightly out of the SD channel on the 3 month chart, SD at 10400.
My conclusion, The NAS is leading. If it continues to go up it may pull the Dow up as well. However, statistically if the NAS pulls back into its SD channel, it is likely that the Dow will fall back into its channel as well.
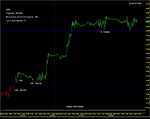
Looking at the short term (10 days), and switching to the NAS 100 rather than the Comp.
NDX has MACD triggered a downturn, Stochastics high, but the 9 and 18 SMAs are channelling up. First warning of a pull back is below 1520. Signal that the longterm downtrend may be over is a break of Friday's high 1528.
Therefore, above 1529 I'll consider Longs, but below 1520 I'll definitely Short expecting a significant retrace.
Looking at the 10 day Dow, MACD has triggered down, Stochastics neutral, but the 9 and 18 SMAs have flattened and are at the closing price level. We will not stay in this state of equilibrium for long. Therefore, if the NDX breaks 1530 up and the Dow breaks 10,500 up, I'll go Long the Dow. However, if the NDX breaks 1520 down and the Dow is below10,444, I'll short the Dow.
If neither happen, I'll sit on my hands.
Wealth warning :- These notes are my personal views and should not be the basis of your trading decisions.
regards, G McA
 
The last two days has seen the Dow stuck in a base/rectangle/consolidation area (call it what you like)

Resistance is in the 480/500 area and support in the 430/450 area.

No point guessing which way it will break IMO, just be ready to go short or long when it does break!
 

Attachments

  • chart.gif
    chart.gif
    19.1 KB · Views: 465
justyn said:
Resistance is in the 480/500 area and support in the 430/450 area.

No point guessing which way it will break IMO, just be ready to go short or long when it does break!
justyn - do you normally enter on the breakout from the channel or do you wait for a re-test (e.g. confirming on an upper-band breakout that the upper-band is now Support)?

With the lacklustre action in recent days, it would seem prudent to get as much confirmation as possible - or maybe I'm being way too cautious/conservative.
 
do you normally enter on the breakout from the channel or do you wait for a re-test (e.g. confirming on an upper-band breakout that the upper-band is now Support)?

The safest entry in my opinion is to wait for the price to pullback to the old res/sup before carrying on in the direction of the breakout.

Mind you, it's often a case of damned if you do and damned if you don't. When you don't jump on the break it motors off without you and when you do it turns out to be a fake break and you're stuck without a paddle.

I look at the indicators and see if it looks dangerous to jump in. See the attached chart.

It looked like 480 was resistance but the two small breaks above it were accompanied by divergence on RSI as well as high RSI levels (75-80) and high CCI levels (200).

Likewise the small break down to 430 was accompanied by CCI of -200 and RSI around 20.

When the indicators are at these levels I am always cautious about jumping in (but not always correct lol!).

Justyn.
 

Attachments

  • chart.gif
    chart.gif
    23.3 KB · Views: 320
I have a feeling we may get a false break of the 10500 level on monday, this level is gonna be jam packed with stops, and I imagine it would benefit certain people if these stops were to be hit. Having said that, a true break of 10500 and we're off to the races! Now how to define a true break?!
 
Effkay said:
I have a feeling we may get a false break of the 10500 level on monday, this level is gonna be jam packed with stops, and I imagine it would benefit certain people if these stops were to be hit. Having said that, a true break of 10500 and we're off to the races! Now how to define a true break?!
I agree with Effkay.

Futures nudged up 7 points or so after the Cash close on Friday. The swing & position shorts already took a pasting last week which helped the surge up as usual, but 10,500 +5/10 is such an obvious stop level for those still hanging in there that I reckon they're bound to be swept. More covering would push it up further but a test of 10,500 as support is probably on the cards later. That thought should keep new shorts on the sidelines until the position resolves. Whether it will hold with so many indicators approachng overbought levels will be interesting and should provide good entry possibilities. Right now I don't see another runaway bull run for the week, but probably some nice swings to get my intra-day teeth into.
 
Salty Gibbon said:
The Dow is going to make another move on Monday m8y.
If I'm reading your codewords correctly Salty, you're saying the Dow is going to move at least 500 pts.

But you don't say in which direction or at what time or by what reasoning you arrive at this conclusion.

Care to elucidate? Or are you just having some fun? :rolleyes:
 
What TheBramble is looking is for, is detail, I guess.

Something like:
Dow will drop to 10,170, between Wednesday, after 20:00 and Thursday before 15:30 UK-time.
Then retrace upto 10,290 at around Friday 17:30.
Then the Dow will continue its downward trip into the week after.
 
No, not at all trendie (although that would be just fine if you nailed it every time :LOL: ) I was just having fun with Salty. (Unless that was your REAL prediction based on, oh no...you mean you got it to work??????...............)

I really am totally anti-predictive in this game and would far rather see a reasoned analysis of current market conditions with a view to the 'if this; then this' type of trading plan. Just as justyn has done.

But let's get this straight - this ain't MY thread - this is a Weekly Dow thread for next week and as I said on the other thread (Where's the Dow going in 2005) I'm not the best person to be involved on a regular basis, so any keen Dowies should feel free to pick it up if it seems to have any mileage in it for future weeks.

TradeSmart - where is you man?
 
Hi

Just a chart - I'll post another when it changes

Sandra
 

Attachments

  • Dow Fut 20May5.PNG
    Dow Fut 20May5.PNG
    71.1 KB · Views: 238
Revised GDP comes out this week on Thursday, recent data suggest the number will be revised up as trade and inflation played less of a drag on the data then originally expected. Current expectations suggest the revision will be sizeable increasing the number to 3.6 or higher depending on who you read.
If the current counts are accurate the indexes will continue to rally into the news, the Tech sector will be ready for a more serious retrenchment as we arrive and may see the fifth wave high on the bell after the data has been released. With a very strong move on the part of the Dow in the early part of the week it to could arrive at a fifth wave high after the bell as well.
Considering the potential here the GDP news may turn out to be a buy the rumor sell the news type event. By Thursday some time after the open we just may see a larger correction of the up move start. We need to monitor market action as we arrive to confirm the potential start of a larger down side correction, but if it does I will be taking the Q's and the Dow short at that time.
I have sent this out as food for thought, we need several things to happen from here before it is confirmed but I wanted everyone understanding what just may happen here, I don't want a mid week change from long to short to catch anyone off guard.

This is from MMitch 401 a free email report I get .
 
Thank you gentlemen, I have been following the thread and I could make a few minor points. One must also look at the intraday movements and the fundamentals behind any alleged breakout. Just the other day last week, it could have been a bearish day if not for some hype about the Chinese Yuan and a certain Mr Snow after lunch in NY. Human Mob behaviour triggered a rally that brought the DOW to the 10500 level. And Oh by the way if there were a tanker disaster or another one of those oil rigs blowing up in Texas, then a breakout could rapidly turn into a breakdown. Then there was the profit taking last Friday. I overestimated its effect and made a loss. So don't bet your life on the charts alone.
 
Top