Need to pick peoples brains.

Rooster34

Well-known member
Messages
333
Likes
66
I want to put 2-3 moving averages on a chart, but not to create a MA cross system or anything like that. I need a fairly accurate indicators for daily, 4h and 1h trends.
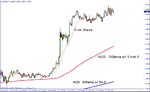
So here is what I'm thinking
Daily 20sma
4h 20sma
1h 20ema
These are NOT to create a cross system or even to generate entry/exit signals just to give me at-a-glance trend recognition while I'm on a 5m chart.

Any feedback is welcome.
 
You are likely to get 100 different suggestions to this, and none will necessarily be wrong. The idea is to find what works for your style of trading and that is best done by testing several ideas yourself. With that in mind here's how I would look at this:

First of all, if you are trading using the 5m chart primarily to get your entry signals then the daily trend is not as important as the others. Try this: If the previous day's candle is RED and today's candle so far is RED or today's price is trading below yesterday's low then consider a downtrend on the daily chart. Opposite for uptrend.

2nd, in theory you would want the trend on all those time frames to be the same. VERY difficult if you are using a 20 moving avg. You can use the 20ma as an exit trigger if you like. I have found what works best for me to determine trends is the 50sma on all time frames.

Play around on a demo with several different settings to see what works best.

Peter
 
What is it you want advice on?

Basically I want to be able to look at a m5 chart and see the overall trend. I am trying to learn how to scalp in the hour or two before work and the hour or two after. It's been completely fruitless untill BING, on went a light. Scalp with the trend only. Must have read it 1000 times. It's just starting to sink in. Lol.
 
Like this ?
 

Attachments

  • gbp-usd-daily-4hr-1hr-5min.gif
    gbp-usd-daily-4hr-1hr-5min.gif
    76.4 KB · Views: 346
Thanks. Im really starting to understand why when someone posts the famous "where do I start at?" question the general answer is "at the beginning".

Nobody can do this stuff for you. Period.
 
Thanks. Im really starting to understand why when someone posts the famous "where do I start at?" question the general answer is "at the beginning".

Nobody can do this stuff for you. Period.

That is probably one of the most important things to learn and understand when you are just starting in trading. Lots of reading, lots of demo, more reading, more demo etc.

A lot of people never even get as far as realising that you are basically on your own in this, even with advice, mentors, books and so on - sooner or later you are on your own making your own decisions. Long way to go but that is a good start :cool:
 
here's one i made earlier, can't get a daily 20 on the 5min tf though.
 

Attachments

  • rc450's holyfail.tpl
    5.8 KB · Views: 266
  • rceu5m.gif
    rceu5m.gif
    18.6 KB · Views: 241
I think it depends what you want to see - do you want to see price almost as is on the other timeframes or do you want to see trend smoothed out?

If it's price itself then consider that sma1 is effectively price so 5 min settings would appoximately be
sma 3 (3x5 min = 15min)
sma 12 (12x5min = 1hr)
sma 48 (48x5min = 4hr)
etc

So if you want, say the 20 period average from each timeframe you multiply 3,12,48 by 20 for your averages.

Please correct the maths if wrong, done quickly in my head but that's the general gist.


I'm looking for smoothed out trends. If I flip between charts and can connect 3 or more points on the trend in an upward or downward line then I have a trend. Im trying to find something that mimics what I see. That way I can flick open a M5 chart and have an immediate idea of larger trends. I MAY have found my answer. But as always there may be no replacement for doing it by hand either. If I take the ten or 15 minutes to draw trendlines, calculate fibs, and draw S&R points as I see them on all the timeframes I'll probably have a better understanding of trend and direction anyway.
I past the lost and confused stage. This stuff is starting to soak it's way past my thick skull. Lol
 
Top