Retail Positioning - The Ultimate Contrarian Indicator

rpmfxtrader

Member
Messages
77
Likes
0
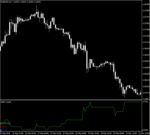
What is Retail Positioning and the RPM?

The RPM, Retail Positioning Meter, calculates the ratio of buyers & sellers. A reading of +2 indicates there are 2 buyers for every 1 seller. Likewise, a reading of –2 indicates there are 2 sellers for every 1 buyer.

Why is it important?

Crowds move markets and at major market turning points, the crowds are almost always wrong. When crowd sentiment is overwhelmingly positive or overwhelmingly negative ? it's a signal that the trend is exhausted and the market is ready to move powerfully in the opposite direction. Sentiment has long been a tool used by equity, futures, and options traders.

-FXCM analyst Jaime Saettele

image_thumb3.png


The strategy below was published in 'Sentiment In The FOREX Market' by Jamie Saettele.
* Retail Sentiment is a contrarian indicator during trending markets.
* The flipping of the ratio is a more accurate signal of a turn in price than extreme positioning.
* The Retail Sentiment confirms the price action during range bound markets.
* Retail Sentiment moves inversely to price.
...


I will be posting here as well as my as I see interesting setups.

RPM (Retail Positioning Meter) should be considered in all trade setups.
 
Last edited by a moderator:
sounds interesting,why dont you join the live forex and set up thread and call a few trades out
 
Nice post! I'm personally a big fan of the sentiment indicators. DailyFX has the SSI indicator showing net positioning of FXCM's retail traders. Was watching it last week as USD/CAD tested the 1.02 level with positioning becoming extreme to the long side as traders tried picking a bottom. But the long positioning was scaled back as USD/CAD approached parity.

Look forward to your thread!

Cheers,

Jason
 
isn't the retail only 3% of the forex market? not sure i would bet on 3% data.

now if i knew where the snb put its trades....
 
its more based on what the stupid people are doing then going against them, as apposed to the amount of trade.
 
RPM Update

RPM VALUES: EURUSD 1.57 USDCHF 1.83 EURCHF 5.21 AND FALLING

The RPM ratio for the EURCHF is currently 5.21.
This signifies that there are 5.21 BUYERS for 1 every SELLER.

RPM is a contrarian indicator. Therefore the EURCHF has a SELL sentiment bias.

Over 1.8 Billion dollars is traded in the Retail FX marketplace a day.

LIVE RPM CHART

EURCHF.gif


EurChf continues to make new lows... how are retail traders holding on? According to Currensee data, break even for most retail positions is 1.4757 that's 400 pips in the hole!!!

Central banks usually intervene when liquidity is low - last Fri evening would have been a prime time... if not last Friday, then when will the Swiss bank intervene?

The EURCHF RPM has fallen from 7 to 5 indicating the ratio of buyers is falling as the price heads lower. Please see my blog for this significance.

My goal is to give you information that can help you in your trading. I believe retail positioning should be considered whether your swing trading or scalping.
 
isn't the retail only 3% of the forex market? not sure i would bet on 3% data.

now if i knew where the snb put its trades....

Best client I ever had as a directional indicator in 16 years in FX traded small (in interbank terms) amounts 100% of the time. It was hilarious because in the end so many people would go with him it ended up being almost self-fulfilling in the process.
 
do bank traders really care what the retail mouse clickers are doing?

bank traders might not be other retail traders can use this info..if a ton of retail people are long something, its ussualy a pretty safe bet they are wrong. almost all my trading is based on this theory
 
Retail Positioning - Friday readings

+1.78 means 1.78 buyers for every seller
-1.78 means 1.78 sellers for every buyer

USDCHF: 1.97 slowly increasing all week
EURUSD: 1.36, peaked for wk on Tuesday as bottom pickers bought into the price drop
AUDUSD: 1.02 fairly steady, peaked wed at 1.26 as traders bought into the price drop
GBPUSD: 1.269, very slight increase over week as price had steady decline
USDCAD: 1.83, steady decline over 2 weeks (3.02 on 3/11), and price trend up since 3/17
USDJPY: 1.269, week started at 1.698 and decline as price shot up
EURJPY: 1.698, up form week start of 1.57, price increasing
 

Attachments

  • examp of sentiment vs price.PNG
    examp of sentiment vs price.PNG
    25.4 KB · Views: 500
Last edited:
Euro Sinks to 10 Month Low
euroSinksToLow.PNG

These types of very negative headlines are a good indication that a reversal is imminent.

A story (especially one about the value of a currency) is not considered newsworthy to a major magazine unless the public is obsessed with the story, and an obsessed public defines extreme sentiment. Since sentiment extremes accompany market turns, by association, major magazine covers are contrarian indicators and signal market turns.

The idea that magazine covers can be used as contrarian indicators in financial markets is not new. Paul Montgomery of Universal Economics has studied the covers of major news magazines for years and found that when a magazine’s cover takes a directional stand on the stock market, that market usually forms a significant top (if the cover is bullish) or bottom (if the cover is bearish). The same concept can be applied to the foreign market.

- Sentiment in the Forex Markets
 
As a matter of interest where do you get your retail positioning info / data from?
I also think extreme positioning in the CoT data is very telling too
 
That's a pretty funny question coming from someone that has: "Give a man a fish, lose a fish. Teach a man to fish, lose your monopoly in fishing." in his signature :)

It is proprietary, but I can tell you it is fundamentally based, not just computed mathematically. So it doesn't change as you change timeframes. That's one of my biggest pet peves about indicators, you can get a buy signal in one time frame and a sell in another, something about that just irks me.
 
Ha! The signature is a joke.

I just wondered where you got the numbers because I agree its useful information!
 
I'm very happy with the response I've gotten from this forum. I've always had a greater respect for the traders here then any other forum.

I've got to grip about 1 thing.... I was banned from babypips. 1 infraction, kid you not, was posting my blog on a page asking for people's blog addr. I didnt have the req num of posts to post a link, so that was 1 of 3 strikes... the other 2 are as silly imhp

The other gripe is honestly trying to help people by posting a solid post, with images, links to videos, and trading rules too long to fit on a post, only to have it 'moderated' to blandness. Ok, griping done.

Back to why anyone is reading this thread....
After creating this indicator (I need a better description for it) gauge? I will not trade without it or against it. There's not many indicators I can say about. The other is a good Elliott Wave count, or certain news reactions / lack there of.

I've made some new charts that hopefully make info more useful. If this link gets moderated out of existance, just google my name, find the blog, and look at live charts...

The functionality is functioning, however some chart symbols / data will not correct itself until the market opens back up.

I'd love feed back about the site. The good and the bad.

I'd also like to get a good poll > 1000 responses... about how many people would be interested in seeing Futures Volume on MT charts. That's another project I was considering. By night I'm a programmer w/ a trading problem, by day a trader w/ a programming problem.

I've still got a few more things to incorporate into the RPM indicator before I jump into that. I am very pleased w/ the results of my work w/ the RPM thus far though. I find it so interesting to see where the ratio of buyers / seller increases and decreases.

It is trader psychology mapped on a chart. Amazing.

A side note... I used to think that I was a contrarian trader when I was betting against the trend, now I know that I was just another retailer trying to pick the bottom. Now I can see how to be a true contrarian.
 
USD Looking Weak short-term

Bigger Picture Wave Count on USDX : 4th wave correction to 38.2% retracement
image.png


WSJ publishes article stating how weak the Euro is.
image_3.png


Traders are beginning to bottom pick, adding to losing positions.
image_4.png
 
... contd Sunday :)

New long positions made an easy stopout target for a low liquidity Sunday morning session.

image.png
 
Top