You are using an out of date browser. It may not display this or other websites correctly.
You should upgrade or use an alternative browser.
You should upgrade or use an alternative browser.
apfx
Junior member
- Messages
- 21
- Likes
- 0
As a relative newbie to FX I hear a lot of people talking about divergence indicators - can anyone tell me what are the best divergence indicators to use in FX? Any advice would be appreciated.
RSI, MACD, CCI, ROC, Stochastic......
rathcoole_exile
Guest Author
- Messages
- 3,925
- Likes
- 767
set up RSI 14 with a 21MA (or 14 MA doesn't make much difference)
look for cross-overs of the MA, of the 50 mid-line, retreats from extremities at 25 and 65, and in particular divergence with Price
look for cross-overs of the MA, of the 50 mid-line, retreats from extremities at 25 and 65, and in particular divergence with Price
set up RSI 14 with a 21MA (or 14 MA doesn't make much difference)
look for cross-overs of the MA, of the 50 mid-line, retreats from extremities at 25 and 65, and in particular divergence with Price
Ever heard of T2WDiverngece indicators for Trade Station v8.3 ??
As a relative newbie to FX I hear a lot of people talking about divergence indicators - can anyone tell me what are the best divergence indicators to use in FX? Any advice would be appreciated.
rathcoole_exile has offered a template for you to take away & explore. But you still got to possess a very thorough, detailed & defined activity plan, otherwise you're gonna have your ass handed to you extremely quickly & often.
Firing off trades willy nilly just because an oscillator extends into extreme levels on the grid (oversold-overbought etc) will inflict all kinds of pain on your account. Same goes for divergences.
You'll reduce your levels of pain somewhat if you obey the common sense observations before laying your $$'s down.
Always try, wherever possible, to run with the dominant flows. It'll make life a whole lot easier if you're engaging (via a micro timeframe) in tandem with a higher timescale trend providing one exists.
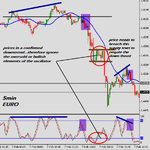
Take the prominant indicator signals in synch with the directional flow, ignoring the counter signals until the price activity changes tack (see chart annotation).
If you're displaying a moving average for trend guidance, then simply obey the directional bias it's highlighting (short it below when it's pointing down & moves back towards it...opposite for long). Though why you'd require that on there in the 1st place is beyond me. Still, each to their own.
Most importantly be very choosy with your candidates. Especially if you're new or lack experience. Discipline will definitely be your best buddy if you're looking to trade this type of execution model.
And experiment with your weapon of choice. RSI(14) is certainly a good marker, but try out Stochs, CCI etc & see if anything takes your fancy. They're all supposed to do a similar job.
Eventually, you'll probably go full circle & dump them all in the bin anyway if you manage to survive long enough.
Common sense will get you a good lick down the road. Studying the basics of supply-demand (support-resistance), order flow & the psychology of what drives-directs & influences price will serve you a whole lot better in the long run. But I guess you'll work that one out when you're good & ready.
Good luck amigo, & stay safe!
Attachments
rathcoole_exile
Guest Author
- Messages
- 3,925
- Likes
- 767
Ever heard of T2WDiverngece indicators for Trade Station v8.3 ??
nope.
pray tell......
rathcoole_exile
Guest Author
- Messages
- 3,925
- Likes
- 767
yes, I certainly wasn't advocating this as any sort of trading plan in isolation from everything else - RR/MM/major trend etcrathcoole_exile has offered a template for you to take away & explore.
Eventually, you'll probably go full circle & dump them all in the bin anyway if you manage to survive long enough.
when I was a new trader I certainly did that, tried everything. then went on to dump it all.
But I have to say I have come back to using RSI (and to a lesser extent, CCI) again, mainly for divergences and also to gain an insight into the strength of a trend.
But as for stochs, MACD and all the other stuff, I never touch them now. IMHO there's nothing they can tell me that's not already on the chart or shown by RSI
Cue for someone to shoot me down in flames ...........
fibonelli
Experienced member
- Messages
- 1,338
- Likes
- 288
yes, I certainly wasn't advocating this as any sort of trading plan in isolation from everything else - RR/MM/major trend etc
when I was a new trader I certainly did that, tried everything. then went on to dump it all.
But I have to say I have come back to using RSI (and to a lesser extent, CCI) again, mainly for divergences and also to gain an insight into the strength of a trend.
But as for stochs, MACD and all the other stuff, I never touch them now. IMHO there's nothing they can tell me that's not already on the chart or shown by RSI
Cue for someone to shoot me down in flames ...........
RSI, CCI, Stochs, SMI, MACD, TSI, TRIX etc all measure momentum and show divergences.
Each momentum indicator has its advantages and disadvantages in terms of showing information.
I personally prefer the Stochastic Momentum Index (SMI) to show momentum and any divergences. The lines are far more smoother than the choppy RSI and not as wild as the CCI.
nkruger
Established member
- Messages
- 855
- Likes
- 76
Each momentum indicator has its advantages and disadvantages in terms of showing information.
I personally prefer the Stochastic Momentum Index (SMI) to show momentum and any divergences. The lines are far more smoother than the choppy RSI and not as wild as the CCI.
Good thread for newbies homework. Well done chaps.
I'm the same, I use the SMI (and a customised MACD) to trade divergences only on the footy, good hit rate on the 2 & 5 min charts daytrading I find. I'd much rather use leading indicators than lagging, which is what divergences provide.
Just my tuppence worth......
nkruger
Established member
- Messages
- 855
- Likes
- 76
As a relative newbie to FX I hear a lot of people talking about divergence indicators - can anyone tell me what are the best divergence indicators to use in FX? Any advice would be appreciated.
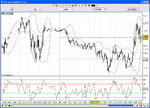
Attached is a chart of Thursday's footy divergence trades that I took. If you watch the 5 or 10 min chart there tend to be fewer signals.
A picture's worth a.........
Nick
Attachments
trendie
Legendary member
- Messages
- 6,875
- Likes
- 1,433
just messing about in between trades.
CCI as divergence anyone? have only eyeballed it.
there is a CCI website that trades hooks from over 200 and -200 back to the zero line.
just threw CCI-20 onto charts, and get good stuff. (default CMC)
I may just be selectively only seeing the winners, as your brain tends to do, but do they seem more "obvious" than other divergences, eg using Stochs.
(I have been a busy bee today, haven't I?)
my take on it is not just divergence, but also taking as pullback triggers possibly?
when looking at divergences, I am only looking for 200+ signals rebounding to form higher/lower hooks in the 100 region, to avoid shorting into a strong bull-move, and vice-versa.
something to have a look into when you have the time.
EDIT: that website: Investors Hub - CS Group (CSG)
(I dont trade the CCi stuff from the website)
Attachments
Marwan2010
Established member
- Messages
- 680
- Likes
- 32
As a relative newbie to FX I hear a lot of people talking about divergence indicators - can anyone tell me what are the best divergence indicators to use in FX? Any advice would be appreciated.
Divergences are great to trade, if you know how to! Also majority of divergences do not work! so you have to set filters so that you do not get sucked into a false divergence trade.
My charting software draws automatic divergence and trendlines. I am looking for aNORMAL divergence in any one time frame PLUS also a HIDDEN divergence in any time frame - occuring at the same time!
Does it happen! Yes it does often, but not frequent. and when that happens it will give you a masiive move!
Eg, a bearish divergence say on a Daily, and then say a Bearish Hidden divergence on a 60 minute chart
try it out - results will be massive!
Marwan2010
Established member
- Messages
- 680
- Likes
- 32
Look at the CHF at the moment! There is a great divergence setup, I am expecting a massive move next week!!
There are BOTH HIDDEN as well as Normal bearish divergence, so will use all my filters for sunday night, and once I get a green signal I will pounce!
as always do a top down approach
There are BOTH HIDDEN as well as Normal bearish divergence, so will use all my filters for sunday night, and once I get a green signal I will pounce!
as always do a top down approach
mr_cassandra
Well-known member
- Messages
- 349
- Likes
- 36
divergence indicators
There are lots of them where divergence is perceived as important. You'll find lots of books and chart websites that will give you chapter and verse lectures on how important negative or positive divergence is.
One thing I rarely see mentioned is the limitiations of time frame based indicators. By this I mean they all analyze stock movement by X number of days into a formula.
The presumes that 'that' time frame is appropriate to the given stock/index you analyze.
So.....if you are using the standard 12-26 macd on a stock which has the audacity to rise for 40 days, the indicator (harrumph) begins to show (harrumph) 'divergence'.
Point of my ramble is indicators are good, but study how they are calculated and be aware of their limitations as outlined above.
As a relative newbie to FX I hear a lot of people talking about divergence indicators - can anyone tell me what are the best divergence indicators to use in FX? Any advice would be appreciated.
yiehom
Active member
- Messages
- 153
- Likes
- 2
trading divergences
There must be a complete guide for trading divergences somewhere on the internet ?
Any address ?
Thanks in advance,
Yiehom
Good thread for newbies homework. Well done chaps.
I'm the same, I use the SMI (and a customised MACD) to trade divergences only on the footy, good hit rate on the 2 & 5 min charts daytrading I find. I'd much rather use leading indicators than lagging, which is what divergences provide.
Just my tuppence worth......
There must be a complete guide for trading divergences somewhere on the internet ?
Any address ?
Thanks in advance,
Yiehom
I would like to make a question.
In the case of stochastic ( and RSI ), in a specific trend ( up or down ), when the line reach the 50 level, does it mean it lost the momentum? or it mean it still has the rest to continue to move?.
By the other hand which would be the shortest time frame to use these kind of indicators (divergence)?.
Windowsill
Well-known member
- Messages
- 305
- Likes
- 39
I would like to make a question.
In the case of stochastic ( and RSI ), in a specific trend ( up or down ), when the line reach the 50 level, does it mean it lost the momentum? or it mean it still has the rest to continue to move?.
By the other hand which would be the shortest time frame to use these kind of indicators (divergence)?.
Its one of those questions that cannot be answered. You need to look at graphs and decide for yourself.
As for time frame......again its up to you to experiment. There will be plenty of traders who will advise 1 min TF & others who would not dream of less than a 1H time frames.