Support/Resistance & Supply/Demand. Have I got it?

gododdin

Member
Messages
63
Likes
8
I would be ver grateful if someone could tell me I've understood this correctly (and put me right if not):

I read that 'price is everything' and nothing else on a chart really matters. So I felt I had to have a good fundamental understanding of how price works. Bear with me while I have a go at explaining (at my current very new level of understanding :))

For every seller there has to be a buyer and vice versa

So hypothetically, if buyers are happy to pay say 1.00 for a share and sellers are happy to receive that price then the market for that share is in equilibrium.

However this is rarely the case because sellers will want to get the best price they can for a share (say 1.20) and buyers will want to pay as little as possible for a share (say 0.80).

So let's say the price falls to 0.80. Now the buyers are happy but the sellers are unhappy and buying volume increases. Demand now exceeds supply.

Inevitably then, prices will rise, which will please the people who bought at a lower price! Traders see the prices rising and jump on the band-wagon. Buying pressure forces the price higher still. I think this is what is meant by 'buyers are in control' but I'm not 100% sure.

So the price rises past the 1.00 mark and approaches 1.20. Now nobody wants to buy because the cost is too high. In fact those who bought at 0.80 are selling like mad trying to make as much profit as possible.

Supply now exceeds demand, so inevitably the prices will fall. The spate of selling forces the price lower. 'Sellers are in control'.

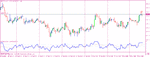
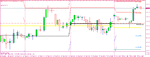
Support is at 0.80 and resistance is at 1.20.

So, please tell me I've understood this correctly and if not, where I've gone wrong.

Many thanks, G.
 
p.s. I know this is a very simplistic model, but I need to know that it's correct before I can build on it to look at trend lines and other more complex tech analysis methodologies.
 
p.s. I know this is a very simplistic model, but I need to know that it's correct before I can build on it to look at trend lines and other more complex tech analysis methodologies.

Simplistic! id say you may be thinking to hard! :).

Support:- A place where there will more likely be people wanting to buy it.
Resistance:- A place where there will more likely be people wanting to sell it.

Supply:- more sellers than buyers.
Demand:- More buyers than sellers.

Reasons to buy and sell:- Not enough room on this page! Hope and fear if i had a gun to my head for the 2 top reasons! :)
 
Last edited:
Ming the merciless vases going cheap......

The market will exploit the typical human condition, creating supply and demand conditions which will give us the minima and maxima price points as a result of this crazy game of bluff and con.

"See this Porcelain here Rodders? well its your finest Ming Porcelain innit me ol china, only its from Taiwan Harry down the chinky.. Come on Rodney down the market son and drive up the prices then leg it, and this time next year will be millionaires........"
 
Don't forget that there will also be people who have gone Short at, say in your example 100. So even if there is no genuine demand at 80to100 the pit traders will artificially run up the demand so as to knock out the Stop Losses of all the shorts. This short covering in turn temporarily adds fuel to the rise until exhausted, then the pros will step in and short the market down until they hunt out the Stop Losses of the mugs who went Long at 100. This in turns adds fuel to the fall until exhausted.

Then, even if there is no genuine demand the pit traders will artificially run up the demand so as to knock out the Stop Losses of all the new Shorts. This short covering in turn temporarily adds fuel to the rise until exhausted, then the pros will step in and short the market down until they hunt out the Stop Losses of the mugs who went Long at 100. This in turns adds fuel to the fall until exhausted. Then the pros step in and artifically create demand so as to knock out the Stop Losses of all the new Shorts.This short covering in turn temporarily adds fuel to the rise until exhausted, then the pros will step in and short the market down until they hunt out the Stop Losses of the mugs who went Long at 100. This in turns adds fuel to the fall until exhausted. Then the pros step in and artifically create demand so as to knock out the Stop Losses of all the new Shorts
This short covering in turn temporarily adds fuel to the rise until exhausted, then the pros will step in and short the market down until they hunt out the Stop Losses of the mugs who went Long at 100. This in turns adds fuel to the fall until exhausted. Then the pros step in and artifically create demand so as to knock out the Stop Losses of all the new Shorts.

ad infinitum......

:clap:
 
and how, you may ask, do the pros know where the traders' Stop Losses will be ?

"cos they know where the juicy lines of historical support & resistance are, they know where the "magic" numbers (-00, -50 etc) are. And they know that that's where most traders will focus their Stops !

So, while never, ever ever trade without a Stop as a newbie, try to think a little differently from the crowd and be a little creative where you put your stops.

Then eventually when you get enough experience from observing this endless cycle, you can start to position yourself alongside the pros - ie figure out where the majority of mug punter Stops are likely to be and fade the move back to hunt them out, along with the pros.

make sense ? It's much harder than it sounds, but not impossible....
 
one step at a time.
just be aware that professional pit traders will regularly hunt out retail traders' stops.
as long as you're aware of it, it helps in a couple of ways -
1. you can be creative in where you place your own stops, and
2. even if you do get stopped out, you can feel confident, all things being equal, of re-entering your trade, knowing that the pendulum is likely to swing the other way soon and you can participate in the move at the second opportunity while the pros go hunting for stops on the other side of the price channel

sound easier ? :confused:
 
here's an example, i'm short at 211.92 with a SL at 212.29
these are based on Pivot levels, I've taken them off as they clutter up the screen.
But the point is, at this stage i believe I am right to be Short.
This may change over the next few hours, but all things being equal, if the pros hunt out my Stop at 229 I'll still be happy to get back into my short position at a second opportunity
 

Attachments

  • gbpjpyh1 250208.gif
    gbpjpyh1 250208.gif
    17.6 KB · Views: 316
Simplistic! id say you may be thinking to hard! :).

Support:- A place where there will more likely be people wanting to buy it.
Resistance:- A place where there will more likely be people wanting to sell it.

Supply:- more sellers than buyers.
Demand:- More buyers than sellers.

Reasons to buy and sell:- Not enough room on this page! Hope and fear if i had a gun to my head for the 2 top reasons! :)


Not sure if I agree entirely with your explanation. You can only identify support and resistance if there are reactions at those levels. Keeping it simple: You could say that resistance is the level where supply exceeds demand causing price to move down from that level, support is where demand exceeds supply causing price to move up from that level. The question is, how many times do you want it to touch those levels and react before you consider it a valid support/resistance level? (Rhetorical question)
 
shown again, with Pivots on.
You'll see that my Short entry , as well as being at Resistance is a spot approx 50% between R1 & R2, with my Stop just above R2
So, if I'm wrong on this trade, I'll still be confident of going short again if stopped out because there is a high probability of a decline from R2

My 3 targets are:
-R1
-mid way between R1 & Daily Piv, move Stop to b/e and let 3rd run to
-Daily Pivot
 

Attachments

  • gbpjpyh1 250208 piv.gif
    gbpjpyh1 250208 piv.gif
    16.5 KB · Views: 280
p.s. I know this is a very simplistic model, but I need to know that it's correct before I can build on it to look at trend lines and other more complex tech analysis methodologies.

Yes, G, you got it. Now don't let anyone shake you loose. You needn't be any more complex, though the more you study this, the more thorough your understanding will be.

Demand is demand as long as a transaction is completed. Whether it's "genuine" or not is irrelevant to the transaction itself, though it may be relevant to the continuation of the move. You'll be able to determine this by the relationship between volume (trading activity) and what's happening to price.

Pat yourself on the back.

Db
 
You could say that resistance is the level where supply exceeds demand causing price to move down from that level, support is where demand exceeds supply causing price to move up from that level.

Yes. As simple as that. The larger the tf the better. One reaction would do for me.
 
Lost me there. Would you mind explaining further?

"For every seller there has to be a buyer and vice versa"

Saying 'a' buyer or 'a' seller gives the impression that it is 1 for 1 when it may or may not be. That's all.
 
Lost me there. Would you mind explaining further?

In other words, tune, there may be lots of buyers and few sellers, which is one of the reasons why price rises. But you know that, and I suspect G knows that as well. It's probably more a matter of precision of speech than a misunderstanding.

Db
 
Yes I got that, but I recognise that it is important. Thank you SO MUCH DBP for confirming that I've more or less got it! :party::cheers: Thanks also RCE for your detailed analysis and charts - I'll spend some time studying that. Now, onwards and upwards!
 
In other words, tune, there may be lots of buyers and few sellers, which is one of the reasons why price rises. But you know that, and I suspect G knows that as well. It's probably more a matter of precision of speech than a misunderstanding.

Db

That isn't what I meant, at all, but doesn't matter.... Nobody is interested :)
 
Top