stupid question?

wasp

Legendary member
Messages
5,107
Likes
879
This seems like a stupid question since I've been trading on and off for some time but I have never quite worked out how, and why, on a one minute chart, the price can move 4/5 points, then retrace and move the other direction, without leaving a trace that it even went that way in the first place. :confused:

This doesn't really affect me the way I trade now but its something thats always confused me and I've never worked out the answer?

I am now going to brace myself and be ready to kick myself for asking this, but does anyone have an explanation to how it can happen?
 
chrisw said:
This seems like a stupid question since I've been trading on and off for some time but I have never quite worked out how, and why, on a one minute chart, the price can move 4/5 points, then retrace and move the other direction, without leaving a trace that it even went that way in the first place.

I am sure that you do know that answer to this, it's just a matter of thinking slightly differently.

By points, I guess you mean cents or pence or whatever.

A price print is made when a trade is actually made, and not when a price is requested. So you may some people trying to buy on Level 2 and some people trying to sell on L2, but no actual trades going off.

OK, so I want to sell my shares at 10.63, the last print (trade) was also at 10.63

I offer my shares at 10.63, no buyers and no trades to 'print...
I change my offer to 10.62, no buyers...
I try again at 10.61 to get a sale, still no buyers, and of course no prints...
Again, desperate to sell my shares, I change my bid to 10.60 and I get a sale.

Others watching this stock see that after a break (possible only 10 seconds) a sale goes off at 10.60 and they think it is a good time to buy, so as buyers come back into the market, the price will go up. The more demand - the higher the price.

The price on the chart then retraces back to to 10.63 after the down gap (10.63 to your sale at 10.60)

I hope that is clear and that I have answered the question you actually asked ;)
 
Last edited:
okay,

So I'm looking at a one minute chart of the GBP/USD.

The price is currently 1.8800. In the last hour a triangle has formed and is coming to the end. Its sitting on the edge of the upside and looks like its going long. Then the price moves 5 pips above the triangle to 1.8805, but then retraces to 1.8800, the chart shows no signs of the move up at all, and then drops back down through the triangle and heads south.

So am I correct in thinking that happened due to the sellers wanting a better price before selling to make more profit, or am I just being really dumb and not understanding the most basic principles of all this!!!!
 
and...

why don't they show on the charts? If the price moved, should it not show on the chart if its a tradeable price? ie quoted in the SB website.
 
chrisw said:
Then the price moves 5 pips above the triangle to 1.8805, but then retraces to 1.8800, the chart shows no signs of the move up at all, and then drops back down through the triangle and heads south.
What/whose charting software are you using, Chris?
 
What kind of chart are you looking at?

A line on close chart will not show the highs and lows of a particular minute.
 
chrisw said:
The price is currently 1.8800. In the last hour a triangle has formed and is coming to the end. Its sitting on the edge of the upside and looks like its going long. Then the price moves 5 pips above the triangle to 1.8805, but then retraces to 1.8800, the chart shows no signs of the move up at all, and then drops back down through the triangle and heads south.

Now I think we are all starting to get confused.

Sorry I would not have mentioned level 2 if I realised that you were speaking of forex, though the principles are still the same.

When you say "Then the price moves 5 pips above the triangle to 1.8805, but then retraces to 1.8800" what exactly do you mean? To me, it sounds as if you are saying that the price on the chart shows 1.8805, then the next price shows 1.8800, if that is so, then that is because this was the last 2 actual trades that went off.

But then you say "the chart shows no signs of the move up at all", which sounds like you saw the price on something other than the charts, as you mention that they didn't happen on the chart :confused:

OK, the price (last trade) is 1.8800
The next trade is when someone buys at 1.8805
The next trade is when someone buys at 1.8800 (no-one else wanted to trade at 1.8805, 1.8804, 1.8803, 1.8802 or 1.8801

A chart in this instance would show the price at 1.8800, then immediately jump to 1.8805, then jump back down to 1.8800 without stopping at any of the prices in between. The chart ONLY shows actual trades.

Think of a "dot to dot" book, the dots may be very close to each other for most of the picture, but some could be quite a distance away. The line (bar on a chart) would show these two points (trades) joining, but wouldn't stop anywhere in between them as there were no more dots (trades).

So am I correct in thinking that happened due to the sellers wanting a better price before selling to make more profit,

WHY there were no trades at this price could be for a multitude of reasons, but it boils down to one thing - no one wanted to buy at those prices - so no trades.

why don't they show on the charts? If the price moved, should it not show on the chart if its a tradeable price? ie quoted in the SB website.

A spread bet company is really a financial book maker, not a broker. You do not actually trade the underlying instrument. In this case you have not bought any currency at all - just 'bet' on the movement. Thus as there were no trades at these prices, you could not bet on them. You would have needed a 'proper' forex account to have the option of doing this.

Hey, just be thankful you are not spread betting on Nasdaq stocks. You can buy a stock one day, and the thing can open the next morning a couple of dollars lower ie. 0.0200 pips to the dowside with no movement in between!

In this case, you 'may' have a chance of getting out on a direct access broker a little easier, but not with a spread bet company as the stock didn't actually trade there during market hours.
 
Last edited:
Roberto

I currently use ADVFN and strategybuilderfx but have seen this occur on numerous packages.

All

I think juanbyte has hit the nail on the head. When taking the time to think about it, I assume it is like watching a 15min chart form. The chart only shows the average of the last 15 minutes and draws a line from A to B ignoring all the spikes and small movements inbetween. In the same essence, a 1 minute chart shows the overall minute move, and although the candle changed shape and offered three different prices, the one that matters is the one thats left when you move on to the next minute.

I think!
 
chrisw said:
When taking the time to think about it, I assume it is like watching a 15min chart form. The chart only shows the average of the last 15 minutes and draws a line from A to B ignoring all the spikes and small movements inbetween. In the same essence, a 1 minute chart shows the overall minute move, and although the candle changed shape and offered three different prices, the one that matters is the one thats left when you move on to the next minute.

I would be interested to know if that is so. I would know to stay away from ADVFN if I was thinking about UK stocks.

This is certainly different to any chart that I have used. All the charts that I have seen are formed real time (or delayed data).

Are you saying that you do not for a bar in one go, but progressively as trades are made? By forming a bar in one go, this means that you have to wait a minute (on 1 min chart) before you see anything, then suddenly you get a bar, then wait another minute twiddling your thumbs and waiting anxiously to see what the action is.

I don't know about forex, but on a fast moving equity that would be death to a day trader - both their account balance and nervous system.

Some scalpers think that tick by tick is too long a gap :LOL:
 
why don't they show on the charts? If the price moved, should it not show on the chart if its a tradeable price? ie quoted in the SB website.

SB prices are one thing, real traded prices are another !
 
Salty, be patient, at this stage of the discussion it is not exactly a wind up, I think it is just fumblings.
 
Let us see if this clears it up.
In a bar chart or a candlestick chart, the price recorded is the last price paid.

This is the price anyone is willing to pay, and it does not matter who it is. In a tick chart this is exactly the same.

What oscillations the price makes in the meantime does not matter, it is only the last price paid that counts and is recorded on the chart.
 
chrisw said:
I think juanbyte has hit the nail on the head. When taking the time to think about it, I assume it is like watching a 15min chart form. The chart only shows the average of the last 15 minutes and draws a line from A to B ignoring all the spikes and small movements inbetween. In the same essence, a 1 minute chart shows the overall minute move, and although the candle changed shape and offered three different prices, the one that matters is the one thats left when you move on to the next minute. I think!
I _think_ I see what you mean. Certainly sounds very unsatisfactory. I suspect indeed that this must be some sort of "line chart" mechanism and you're not actually seeing the ends of the bars. Sounds dreadful. :( Unless I've still misunderstood, of course.
 
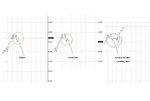
okay...

Thought an example may work better!?
 

Attachments

  • ex 1.jpg
    ex 1.jpg
    56.8 KB · Views: 210
Salty Gibbon said:
All this talk of bars makes me feel like a beer !
You look like a beer as well :cheesy:
Good idea though ;)

ps. Sharky, where's the BEER smilie? :idea:
 
If this is a 1 minute chart as opposed to a tick chart, then it is a 'line' chart.

If so, then my advise is to move to a 'bar' chart or a 'candlestick' chart. Either one of these will be much better suited to trading. Line charts are good for magazines and other simple examples, but not for actual trading.

Line charts only give you one point in the trading range of that period (usually the close), bars and candles give you the high, low, open, close and you can watch the progress in between.

Oatman, I believe that beer charts only work in the more 'fluid' markets :D
 
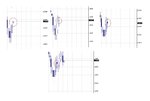
So at which point do you know the true level?

After its moved on to the next candle?
 

Attachments

  • 1.jpg
    1.jpg
    54.3 KB · Views: 200
It must have been a stupid question since nobody seems to have a clue what you're talking about.

Think I'll have a beer.
 
Top