You are using an out of date browser. It may not display this or other websites correctly.
You should upgrade or use an alternative browser.
You should upgrade or use an alternative browser.
Articles
Filters
Show only:
Loading…
No matter which market you trade – stocks, forex or futures – each second the markets are open provides an opportunity to trade. Yet not every second provides a high-probability trade. In a sea of nearly infinite possibilities, put each trade you consider through a five-step test so you'll only take trades that align with your trading plan and offer good profit potential for the risk being taken. Apply the test whether you're a day trader, swing trader or investor. At first it will take some practice, but once you become familiar with the process, it takes only a few seconds to see if a trade passes the test, telling you whether you should trade or not.
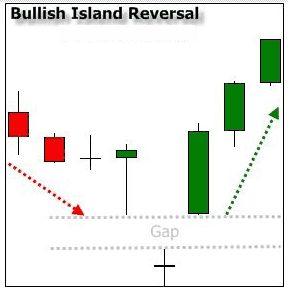
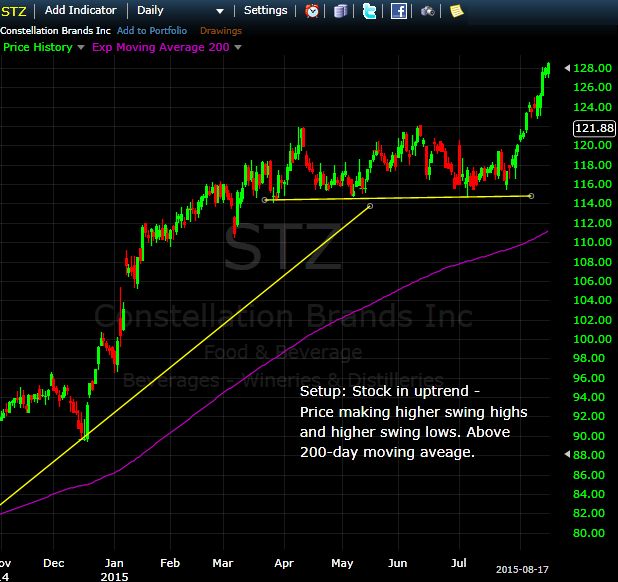
Step 1: The Trade Setup
The setup is the basic conditions that need to be present...

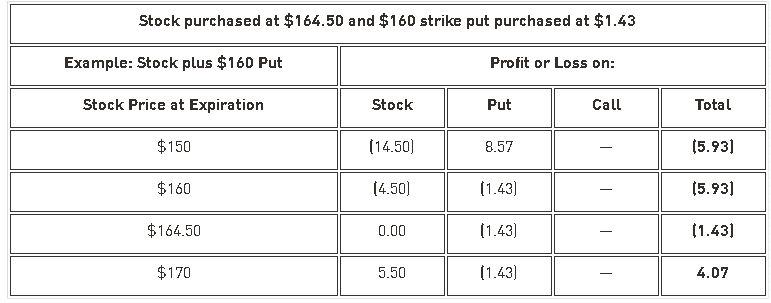
With the recent rise in volatility, there has been a lot of talk about a potential equity market crash. Many investors are nervous about when, not if, this crash will occur and are looking for some protection for their stock portfolios. Closing out your stock positions is an option, but many stocks pay dividends that the investors do not want to relinquish even when facing the threat of, or, during a crash. Another reason for holding on to a stock position is to avoid tax ramifications on profitable sales of securities.
The most common protection that traders/investors seek is to buy puts on stocks they are holding. The value of the put will increase as the price of the underlying stock decreases thus covering the losses in the...
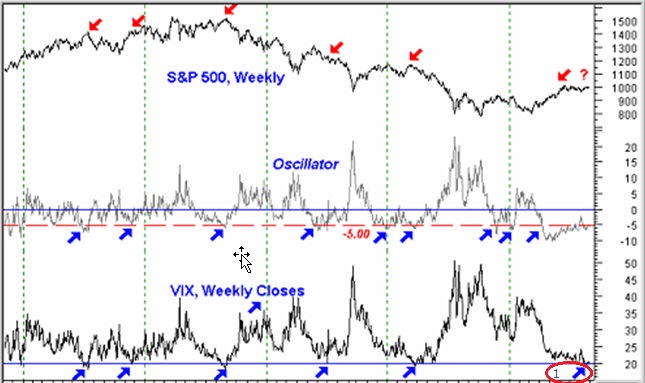
A Google search on VIX yields some unexpected pages: the name of a Czech rock band, a swim wear catalog and the Vienna Internet Exchange. Interesting stuff, but not quite what we had in mind. The CBOE's VIX is a popular market-timing indicator. Let's take a look at how VIX is constructed and how investors can use it to evaluate U.S. equity markets.
What Is the VIX?
VIX is the symbol for the Chicago Board Options Exchange's volatility index. It is a measure of the level of implied volatility, not historical or statistical volatility, of a wide range of options, based on the S&P 500. This indicator is known as the "investor fear gauge," because it reflects investors' best predictions of near-term market volatility , or risk. In general...
Are you a risk taker? When you're an individual trader in the stock market, one of the few safety devices you have is the risk/reward calculation.
Risk v Reward
Sadly, retail investors might end up losing a lot of money when they try to invest their own money. There are many reasons for this, but one of those comes from the inability of individual investors to manage risk. Risk/reward is a common term in financial vernacular, but what does it mean? Simply put, investing money into the markets has a high degree of risk, and you should be compensated if you're going to take that risk. If somebody you marginally trust asks for a $50 loan and offers to pay you $60 in two weeks, it might not be worth the risk, but what if they offered to...
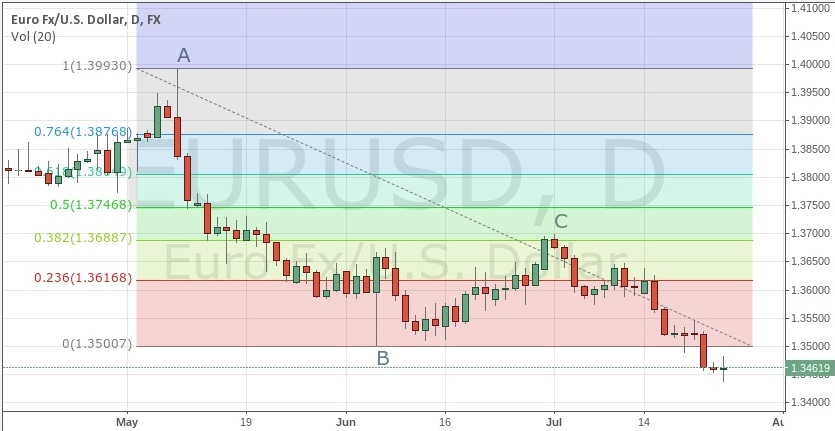
Leonardo Pisano, nicknamed Fibonacci, was an Italian mathematician born in Pisa in the year 1170. His father Guglielmo Bonaccio worked at a trading post in Bugia, now called Béjaïa, a Mediterranean port in northeastern Algeria. The young Leonardo studied mathematics in Bugia and during extensive travels, he learned about the advantages of the Hindu-Arabic numeral system. In 1202, after returning to Italy, Fibonacci documented what he had learned in the "Liber Abaci" ("Book of Abacus"). In doing so, he popularized the use of Hindu-Arabic numerals in Europe.
The Fibonacci Number Sequence
In the "Liber Abaci," Fibonacci described the numerical series now named after him. In the Fibonacci sequence of numbers, after 0 and 1, each number is...

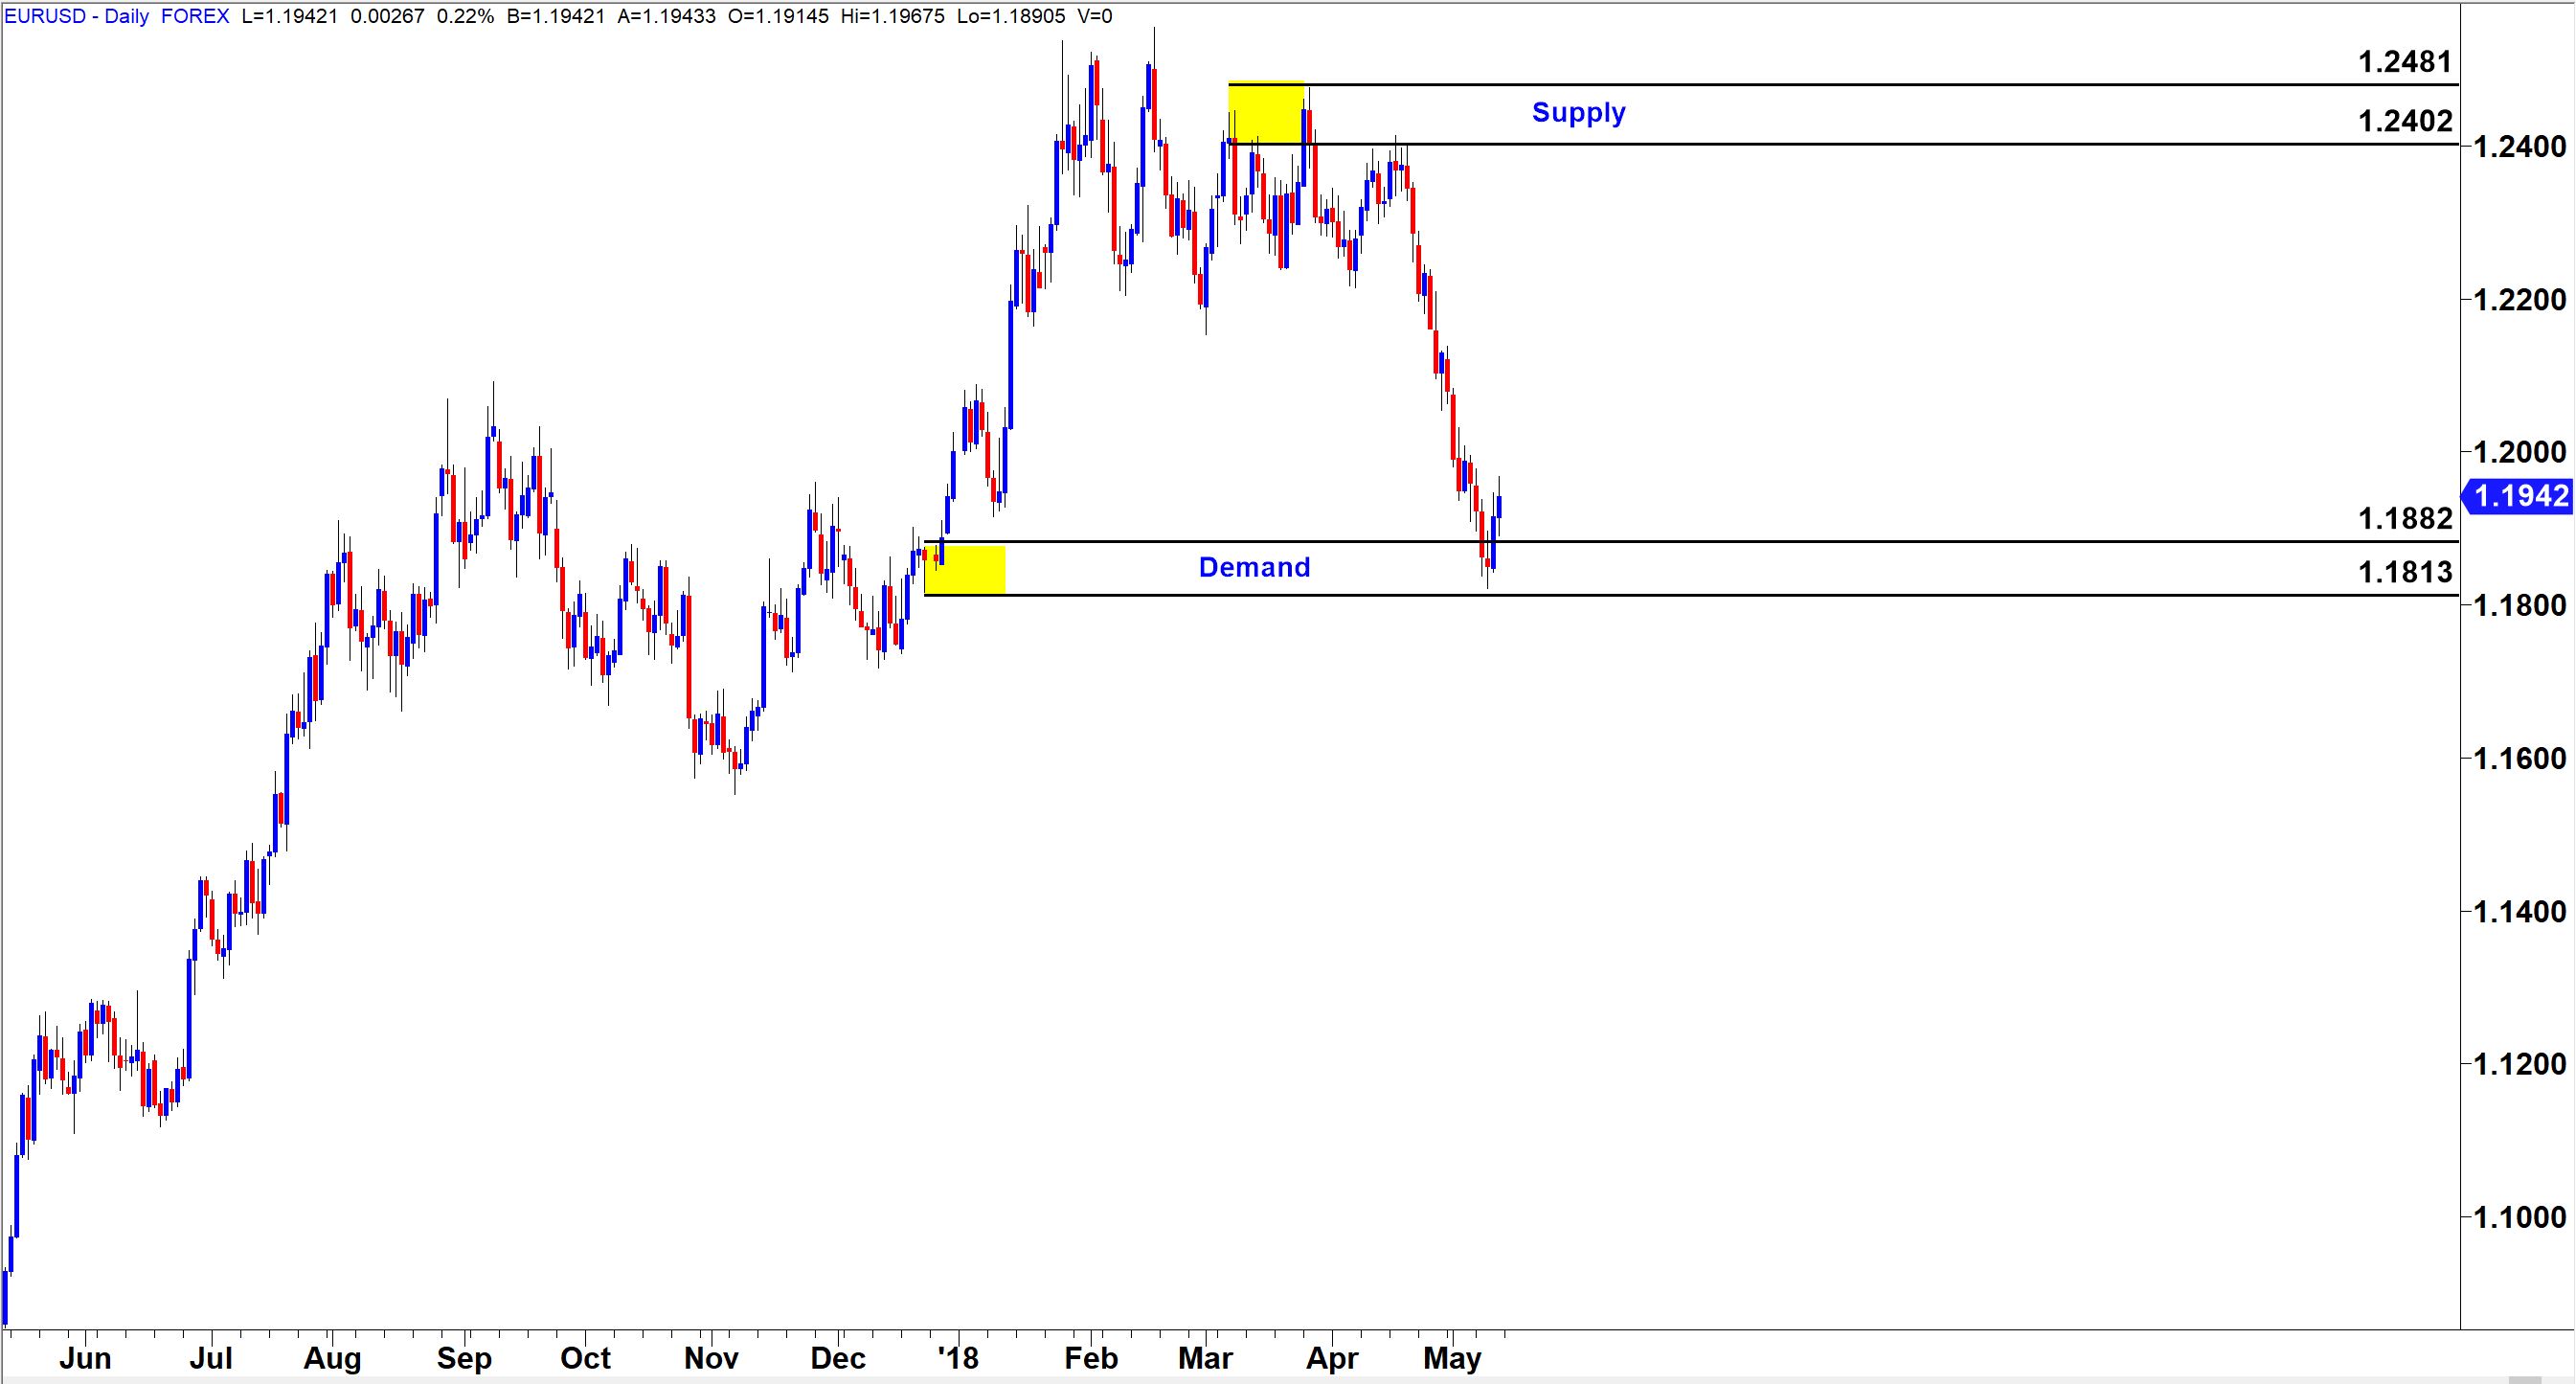
Price Charts: Price charts represent the footprints of money, ie. peoples’ buy and sell decisions. Areas on any price chart where you see lots of trading activity suggests relative equilibrium in supply and demand. Areas on the price chart where you see little activity suggests supply and demand are out of balance; this is where price turns.
Time Frames: You can look at a price chart in any time frame you want these days. The purpose of looking at multiple time frames is the same as why a Doctor takes multiple X-rays when looking at a broken arm, for example. The 2 or 3 X-rays will all look different, but it’s still the same arm. Looking at multiple time frames helps us figure out where the real supply/demand imbalance is in a market...
Many people participate in the stock markets, some as investors; others as traders. Investing is done with a long term view in mind, years or even decades. Trading, meanwhile, is done to pocket gains on a regular basis.
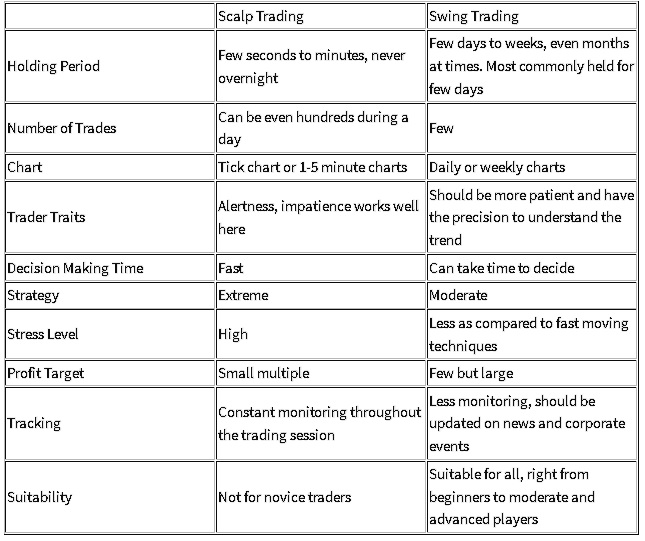
There are many sub categories of traders. One of the common ways to distinguish them is the “time period” for which traders hold a stock, which can vary from a few seconds to months or even years. Some of the popular trading strategies are day trading, swing trading, scalping and position trading. Choosing a style that suits your own trading temperament is essential for the success in the long term. This article lays out the differences between the scalping strategy and a swing trading strategy.
Scalping
The strategy...

Trading systems are usually thought of as complex computer programs requiring massive amounts of data to calculate the best entry and exit parameters. But in trading, often the best solution is the simplest. In fact, one of the best known trading systems doesn't even require a computer. Read on as we take a look at the weekly rule system and show you how this simple system can help you profit from a trade.
Trend following is a well-known concept underlying many successful trading systems. Probably the first such system was the weekly rule devised by Richard Donchian. Test results for this system were published as early as 1970, and it was found to be the most profitable system then known.
Donchian was called the "father of modern...
Psychology is the often overlooked intangible aspect of trading, because it is unquantifiable and generally misunderstood by most traders and investors. Unlike the precise mathematical formulas used in technical analysis, we cannot easily reduce human behavior to a mathematical equation that can be plotted on a graph as a trendline or as a series of variables that we can examine in detail, throughout history.
That said, much of the current research in social sciences is attempting to bring psychology more in line with mathematics for the precision that it gives to experimental methods. Mathematical methods are applied to behavioral science for the purpose of observing and comparing human behavior, according to a set of strict numerical...
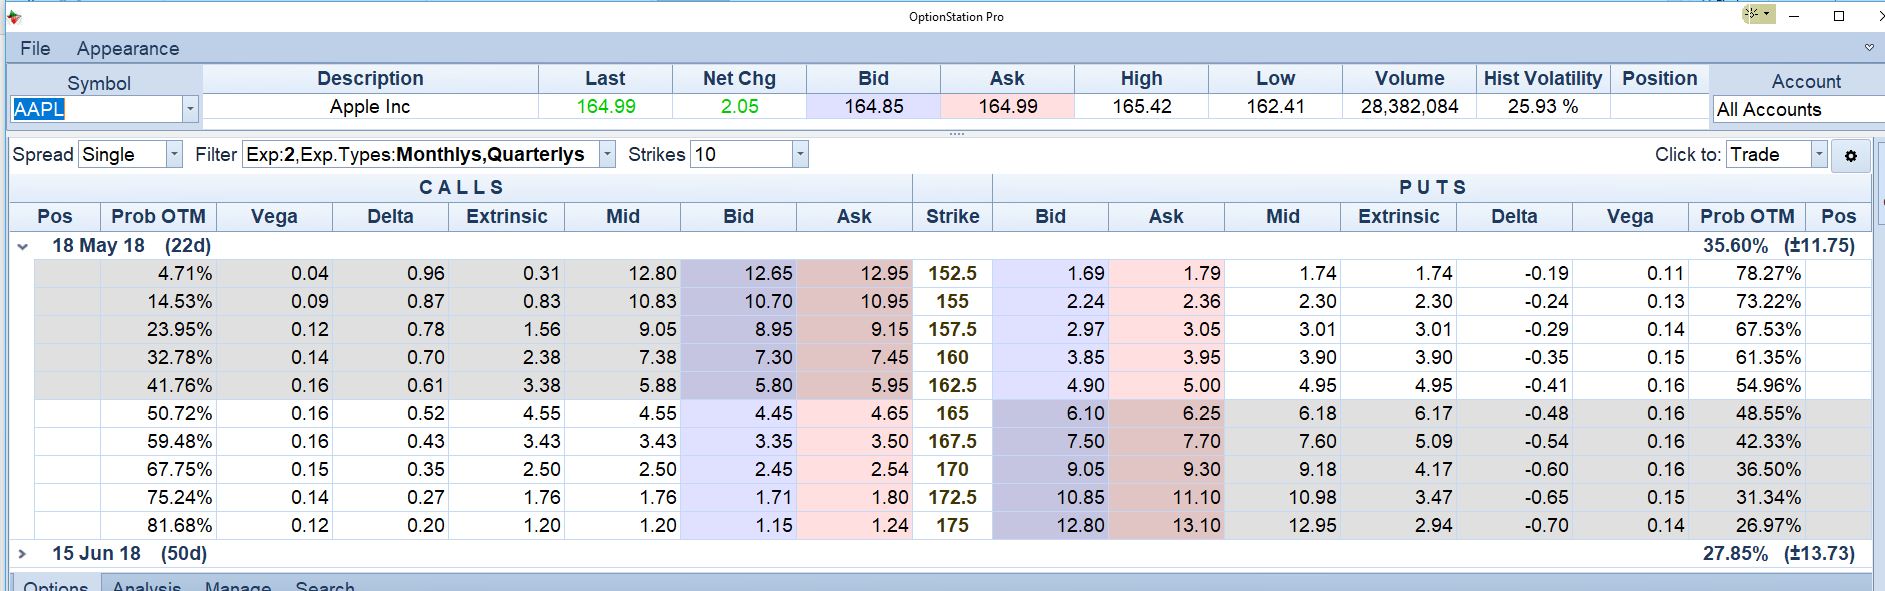
Over the last 15 years that I have been trading, I have made efforts to fully understand multiple asset classes as I believe this is the best way for anyone to ensure maximum diversity, minimum risk and, of course, better profits across their investment portfolio. While I have always been very active in FX trading, it has always been options trading which sparked the most interest for me due to its multiple layers of complexity and strategy. With so many contracts, expiry dates and a whole host of strategies ranging from iron condors and strangles to vertical spreads, options are truly unique and allow us to make money from markets moving up, down and sideways, too. They can be used for position protection and stop losses as well, with...
Lucrative salaries, hefty bonuses and creativity on the job have resulted in quantitative trading becoming an attractive career option. Quantitative traders, or quants for short, use mathematical models to identify trading opportunities to buy and sell securities. The influx of candidates from academia, software development and engineering have made the field quite competitive. In this article, we’ll look at what quants do and the skills and education needed.
What Do Quantitative Traders Really Do?
The word "quant" is derived from quantitative, which essentially means working with numbers. The advancement of computer-aided algorithmic trading and high-frequency trading means there is a huge amount of data to be analyzed. Quants mine...
S&P 500 index futures surged in popularity in the past decade after the SEC’s pattern day trading rule triggered an exodus of retail capital out of equities and into Globex, CME’s 24-hour electronic trading platform. Volume hit a historic peak in 2011, underpinned by a worldwide transition in risk from individual securities to broad macro instruments, driven by an explosion in ultra-modern derivative products. Along with the Nasdaq 100 and Russell 2000 Index futures, the threesome carve reliable road maps for active traders seeking intraday buy and sell signals.Futures trading in the hours between New York’s U.S. equity close and the next morning’s open captures market-moving events in Asian and European bourses. In turn, these...
Traders and investors who seek to limit potential losses can use several types of orders to get them into and out of the market at times when they may not be able to place an order manually. Stop-loss orders and stop-limit orders are two tools that can accomplish this, but it is critical to understand the difference between the two similar sounding orders.
Stop-Loss Orders
There are two types of stop-loss orders.
1) Sell-stop orders protect long positions by triggering a market sell order if the price falls below a certain level. The underlying assumption behind this strategy is that if the price falls this far, it may continue to fall much further, so the loss is capped by selling at this price.
For example, let's say a trader owns...
You probably know that a Call option gives you the right to buy a stock at a fixed price; and that a Put option gives you the right to sell a stock at a fixed price. These rights are what give the option its value. When you take advantage of these rights it is called exercising options.
When Should You Exercise Option Calls or Puts?
Under what conditions would one want to exercise the rights the option gives? The answer is that exercising options is almost never beneficial. Only a small fraction of the options that are created are ever exercised, and for good reason.
Does this mean that most option buyers are buying something worthless? Not at all. It just means that there is almost always a more profitable way to close out an option...
One of the most enduring sayings on Wall Street is "Cut your losses short and let your winners run." Sage advice, but many investors still appear to do the opposite, selling stocks after a small gain only to watch them head higher, or holding a stock with a small loss, only to see it worsen.
No one will deliberately buy a stock they believe will go down in price and be worth less than what they paid for it. However, buying stocks that drop in value is inherent to investing. The objective, therefore, is not to avoid losses, but to minimize the losses. Realizing a capital loss before it gets out of hand separates successful investors from the rest. In this article, we'll help you stand out from the crowd and show you how to identify when...
Risking capital under pressure can be like a time bomb ticking away in your head. One moment everything is under control and then (in the blink of an eye) the thought or threat of losing capital pulses through you – creating an emotional avalanche that covers up rational thinking. It may be at an entry point, where you have to come to grips with the possibility that you could lose money – and a shudder runs through you. It could be when your position goes against you and you feel the money slipping through your fingers – and an urgency consumes you to get it back before it’s too late. Or it could be after your position has turned profitable and waves of anxiety pulse through you – and you regretfully get out way too early with a...
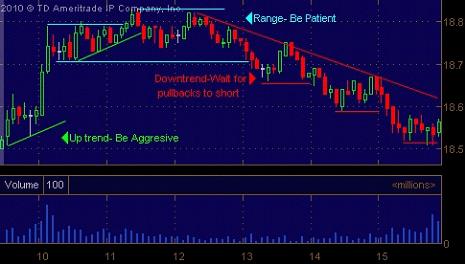
For active stock traders, having different strategies for different market conditions is a crucial factor. Trends emerge, fade, reverse and ranges develop, all playing out in ever broader trends and ranges, all within a single trading session. Thus, the trader is faced with a choice: trade one strategy and profit only at times that suit the strategy, or trade several strategies that allow them to trade profitably, in an array of market conditions. Different times of the day pose different opportunities and threats, and must be accounted for. Once several strategies have been adopted, it is crucial that the trader know when to implement each type of strategy.
Three Types of Trading Strategies
For day traders, strategies will generally...
Amid thousands of stocks actively trading in global markets, a significant percentage are very thinly traded stocks, in other words, stocks that trade irregularly at low volumes. Investors should be aware of the considerable risks of trading in these low-volume stocks.
One risk of low-volume stocks is that they lack liquidity, an important criterion in stock trading. Liquidity is the ability to be easily bought or sold in the market without a change in price. This means that a stock which is trading at $25 per share should be easily bought or sold in large amounts (say 100,000 shares) while still maintaining the price of $25 per share. For stocks, a good measure of liquidity is the average daily trading volume. In general, any stock...
I have often discussed how awareness or the lack thereof is profoundly important to trading. About 95% of everything that goes on in your brain and mind is out of your awareness. Just consider that your unconscious brain is responsible for all the communication between cells, organs, muscles and bones as well as motor functions, respiration, heartbeat, immune functions, overall regulation and so on and so on. In fact, only about 3% falls under the purview of your conscious mind. So, the vast majority of your system and what it is doing is out of your awareness…and that’s a good thing.
Can you imagine having to think about breathing, beating your heart or defending yourself against micro-organisms? It would be a disaster to say the...

The idea of volatility makes many traders feel jittery and uncertain. Volatility can make traders:
1) Too frightened to place a trade
2) Panic and close a trade early
The irony is that in times of high volatility, profit targets have the best chance of being hit. Often after being frightened out of a trade, the trader will quote ‘Sod’s law’ (Murphy’s Law in America) when the market turns around and carries on in the originally forecasted direction.
The pattern of volatility
Volatility ebbs and flows in the market. The basic pattern is that the market moves from periods of high volatility to periods of low volatility. Sharp bursts of activity up or down are followed by periods of relative calm. It may be that the trend has...
Exchange-traded funds (ETFs) are ideal for beginning investors because of their many benefits likes low expense ratios, abundant liquidity, wide range of investment choices, diversification, low investment threshold, and so on.These features also make ETFs perfect vehicles for various trading and investment strategies used by new traders and investors. Here are seven of the best ETF trading strategies for beginners presented in no particular order.
1) Dollar-Cost Averaging
We begin with the most basic strategy: dollar-cost averaging. Dollar-cost averaging is the technique of buying a certain fixed-dollar amount of an asset on a regular schedule, regardless of the changing cost of the asset. Beginner investors are typically young...
When you open your first option trading account (or add option capability to an existing equities brokerage account), your broker assigns you an options approval level. Usually the levels run from Level One to Level Five. Your approval level determines which option strategies you are allowed to use in that account.
The idea behind the approval level structure is that the riskier an options strategy is, the more options experience and/or capital should be required. Here is a typical list of approval levels and the types of trades allowed:
Level 1 – Covered Calls, Protective Puts (i.e. option positions that also include a position in the underlying stock)
Level 2 – Level 1 items plus speculative call and put buying (i.e. buying calls...
Indicators, such as moving averages and Bollinger Bands, are mathematically-based technical analysis tools that traders and investors use to analyze the past and predict future price trends and patterns. Where fundamentalists may track economic reports and annual reports, technical traders rely on indicators to help interpret the market. The goal in using indicators is to identify trading opportunities. For example, a moving average crossover often predicts a trend change. In this instance, applying the moving average indicator to a price chart allows traders to identify areas where the trend may change. Figure 1 shows an example of a price chart with a 20-period moving average.
Fig1: QQQQ with a 20-period moving average. Source...
Very few films capture the essence of life as a day trader. The pressure of walking the tightrope between profitability and looming losses is rarely captured in mainstream films. While movies such as "Wall Street" and "Boiler Room" glamorize the lifestyle of accumulating wealth by any means necessary, they do not capture the essence of actual trading in the trenches. These five movies illustrate key lessons every trader can take with them to understand more about their career.
1. "Rounders" - Money Management and Spotting Fades
This movie is a favorite among poker players, and it exemplifies the parallels that exist between playing poker and trading the markets. The two main characters literally represent the two sides that exist in...
I’ve often been asked how I manage to work in this profession without losing my mind. The truth is, I think I have lost little bits of it over time. Just kidding! Seriously though, I don’t blame people for thinking that traders must be a bit crazy for doing what we do and, quite honestly, I think we must be able to handle the volatility from both the emotional/mental and financial perspectives.
I watched a very interesting video presented by a YouTube channel called “After Skool” that delved into emotion vs logic and how we live in a world that places far more emphasis and importance on the latter than the former. Among the many other insightful things that were stated by the narrator, probably the most important insight was that...
When technical tools are used judiciously, their value cannot be overstated. And every time you apply a tool of technical analysis, you are calculating a consensus of bullishness or bearishness among all market participants.
For example, the moving average convergence-divergence (MACD) is simply a tool that measures shifts in consensus from bullishness to bearishness, and vice versa. Extending the basic MACD to a deeper level, we find the MACD-histogram, which is actually a tool for determining the difference between long-term and short-term consensus of value. The measure tracks the difference between the fast MACD line (short-term consensus) and the slow signal line (longer-term consensus).
The principles of market psychology...
If moving averages are hurting your trading or investing performance and getting you below average results, it’s because that’s exactly what they are designed to do. They are a very popular tool for novice retail traders and investors yet hardly used or thought about by the professional trader/investor. Helping you understand this is the focus of this piece.
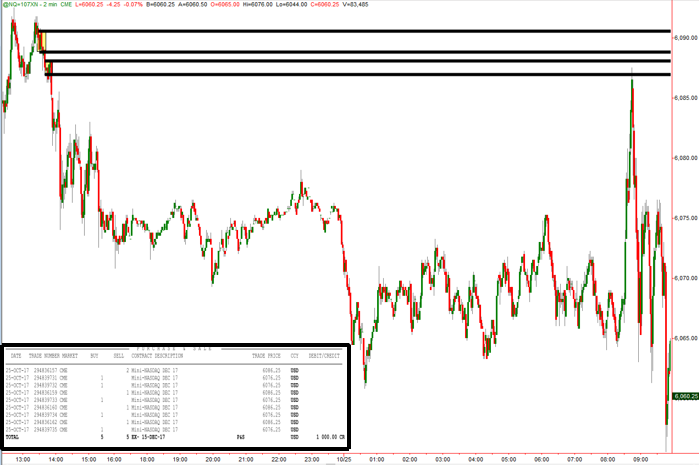
Instead of going through many charts to find the perfect picture to use as an example to illustrate my logic, I like to use real trades as examples from our live trading rooms.
Below is a trade I took in the NASDAQ futures. We identified 2 strong supply zones where banks were selling that morning as seen on the chart below. When price rallied and reached the supply zones, I...
Risk management is an essential but often overlooked prerequisite to successful active trading. After all, a trader who has generated substantial profits over his or her lifetime can lose it all in just one or two bad trades if proper risk management isn't employed. This article will discuss some simple strategies that can be used to protect your trading profits.
Planning Your Trades
As Chinese military general Sun Tzu's famously said: "Every battle is won before it is fought." The phrase implies that planning and strategy - not the battles - win wars. Similarly, successful traders commonly quote the phrase: "Plan the trade and trade the plan." Just like in war, planning ahead can often mean the difference between success and failure...
Finding the Blind Spot Sabotaging Your Potential
You know it’s possible. You feel it inside you. Every day you see the potential in the markets just waiting to be tapped. And you know you can do it. But even with your best effort, you consistently face the realization that achieving your trading potential is far more elusive than you initially figured. It’s up and then down. You think you finally have your act together – then you give it all back and more. Consequently, time and capital drag on without achieving the kind of success you know is possible. What are you missing that could be the defining difference in your trading or active investing?
No one warned you about the mindset problem you were going to run into when...