You are using an out of date browser. It may not display this or other websites correctly.
You should upgrade or use an alternative browser.
You should upgrade or use an alternative browser.
trades for 30th
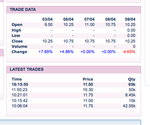
Sorry not very clear. It shows trade of 4450 at 15 and the bid and offer was 14-16
thats fine...thats awsome information!!!!!!!
does that come in real time?
or just after the trading day is finished?
looks like someone bought 38,000 for more that i paid!!
i wonder if they have sold them now...or if they are holding.....
is this that sharescope software you mentioned?
yeah, realtime!
Proquote International
that is friggin awsome!!!! lol
so as soon as i BOUGHT, they got streamed down like that to people with systems like yours?
so you can see, what people are buying....and/or selling.....and spot opportunities like that.....
IS THIS CALLED LEVEL2 PRICING SYSTEM?
all i can see on selftrade is the LAST 5 trades, the price and the quanity (does not say if it was buy or sell)...and just the volume bar graph of overall volume traded.......
Last edited:
Well im your case you can't actually tell if it is a buy or sell because you dealt in the middle. Here is the screenshot of the level2 order book. Would normally be live/realtime.that is friggin awsome!!!! lol
so as soon as i BOUGHT, they got streamed down like that to people with systems like yours?
so you can see, what people are buying....and/or selling.....and spot opportunities like that.....
IS THIS CALLED LEVEL2 PRICING SYSTEM?
all i can see on selftrade is the LAST 5 trades, the price and the quanity (does not say if it was buy or sell)...and just the volume bar graph of overall volume traded.......
Attachments
Well im your case you can't actually tell if it is a buy or sell because you dealt in the middle. Here is the screenshot of the level2 order book. Would normally be live/realtime.
the up pointing arrow does not mean bought?
and down pointing arrow does not mean sold?
so the only way you can tell if its buy or sell is matching up the bid and ask prices?
IS THIS CALLED LEVEL2 PRICING SYSTEM?
No. I think it just means that price is higher (green) or lower (red) than the last trade. No one knows if they are buys or sells.the up pointing arrow does not mean bought?
and down pointing arrow does not mean sold?
so the only way you can tell if its buy or sell is matching up the bid and ask prices?
IS THIS CALLED LEVEL2 PRICING SYSTEM?
Yes, that's level2. Normally the yellow strip shows the "touch" (best bid and cheapest offer)
No. I think it just means that price is higher (green) or lower (red) than the last trade. No one knows if they are buys or sells.
Yes, that's level2. Normally the yellow strip shows the "touch" (best bid and cheapest offer)
so Level2 pricing, you cant see if a random trade is a buy or sell?
hang on a minute...EACH TRADE IS A BUY AND A SELL, ISNT IT?
but there should be a way to tell if buyers are more dominant ..... if people are buying more often than selling........
(you didnt answer your private message)
so Level2 pricing, you cant see if a random trade is a buy or sell?
hang on a minute...EACH TRADE IS A BUY AND A SELL, ISNT IT?
but there should be a way to tell if buyers are more dominant ..... if people are buying more often than selling........
(you didnt answer your private message)
"Each trade is a buy and a sell"; or a sell and a buy??
If the price is trending upwards you can assume the prices nearer the offer are buys and nearer the bid sells.
"Each trade is a buy and a sell"; or a sell and a buy??
If the price is trending upwards you can assume the prices nearer the offer are buys and nearer the bid sells.
so all level2 pricing just shows you the trade as in price executed and volume, right?
it cant show you if it was instigated by a buyer or a seller.....right?
but each trade is a buy AND a sell..... when you see a trade, what do you assume? just gotta look at the big picture, spread, etc and presume...?
do you look at recent trading histroy, when making your trades?
As I say, if you look at your trade you cannot tell if it is a buy or a sell, can you?
If I am interested in a share I will look at volume and maybe follow that. Sometimes you find the spread closes up just before a change of direction. It's a lot of things added together (and then I can still be wrong!)
A wide spread usually means there is not much activity (the MMs need a wider spread to make money on little volume). As the volume picks up they can narrow the spread (maybe to encourage trading) as they are making money on more trades.
It is more useful looking at trades of say 100000 at 15p (£15000) as this looks more like professionals rather than 4450 @ 15p
right....
"If I am interested in a share I will look at volume and maybe follow that"
you mean see what is being trading alot volume wise?
So it is more safer trading stocks where there are trades looking like £15k etc, as its a sign of professional traders going about their business? ie highlighting a hot active area....eg its always a good sign when thers lots of shares being traded of one company...right?
volume in top table is ZERO on all the days.
But the bottom table has thousands of shares traded showing.
Could these latest trades be out of hours trading or after hours trading?
and yahoo finance is showing lots of trading on one day, and selftrade is showing no trading on the same day.
But the bottom table has thousands of shares traded showing.
Could these latest trades be out of hours trading or after hours trading?
and yahoo finance is showing lots of trading on one day, and selftrade is showing no trading on the same day.
Attachments
Similar threads
- Replies
- 0
- Views
- 5K
- Replies
- 0
- Views
- 3K