Views of Atlantis on financial markets

AtlantisCapitalGroup

Junior member
Messages
23
Likes
0
In this discussion, we will regularly write our views on currency pairs, stock indices or even commodities. Check it out and give us your opinion too. We are very passionate about markets, so there will be a lot to talk about!
 

Attachments

  • cover_fb.png
    cover_fb.png
    837.9 KB · Views: 235
GBPJPY upcoming short

GBPJPY made a strong bullish move in last days, but it’s probably not gonna last. We see price exhaustion and potential move downwards because the market reached trendline and Fibonacci level 50%
 

Attachments

  • GBPJPY d1 short.png
    GBPJPY d1 short.png
    924.6 KB · Views: 220
Benjamin Graham

Do you know Benjamin Graham? He is known as the "father of value investing" and the author of the book called Security Analysis which Warren Buffett describes as "the best book about investing ever written". Today, it's 42 years since he left this world, but he also left a big impact.
 

Attachments

  • BG.png
    BG.png
    420.6 KB · Views: 204
Waiting on Bitcoin to break $6000

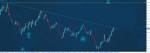
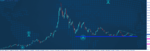
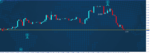
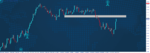
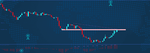
At the beginning of February 2018, Bitcoin reached the bottom $6,000 after reaching $20,000 at the end of December 2017. Since then Bitcoin was not able to get below the support level $6000 even though there were many attempts to break this level. Many people started to get impatient because it already looks like Bitcoin will never go below $6000, but what if it will? We are in a phase where you need to be patient. Until Bitcoin will not create a higher high, there is no uptrend in a sight. It is constantly creating lower highs, so we will probably see a break of support level $6000, or at least false-break. From a statistical point of view, we are in the second-longest downtrend on Bitcoin. The longest lasted 411 days from 30 November 2013 until 14 January 2015. Now downtrend lasts more than 270 days. That means we are close to the end of a downtrend, but it's still there creating lower highs, but not lower lows. If Bitcoin breaks the support zone $6000 it can cause a dramatic selloff in markets, but it can also mean soon ending of that downtrend. We are bearish in short-term view, but we are bullish in long-term. Until Bitcoin won't get to $5000, we are waiting. So, the important thing here is that Bitcoin is very likely to break or at least false-break support level $6000 and we are close to the end of a downtrend, so be patient.
​​​​​​​
 

Attachments

  • btc.png
    btc.png
    944.5 KB · Views: 235
GBPNZD failed to break psychological resistance

On 11th September GBPNZD tried to break psychological round number 2.0000 but failed to do so. Within the next 2 weeks, we saw a downturn of almost 500 pips which clearly showed that the market is not going through that resistance. Now it made a pullback and we see it as an opportunity to get in. GBPNZD stopped at Fibonacci 50/61.8 and with a proper stop-loss, you may be able to catch a bigger move to the downside. Potential profit target is zone 1.9400-1.9470.
 

Attachments

  • graf_1.png
    graf_1.png
    762.8 KB · Views: 249
USDJPY approaching level 113

From the beginning of September, there is a beautiful uptrend on USDJPY. Will it continue? The market is currently at level 113 and a few pips below important resistance. So, the important question is if there is going to be a breakout or not. There's FOMC soon and if they raise the interest rate from 2% to 2.25%, we will probably see a strong breakout to the upside. If they won't change interest rates there might be a false breakout and then move to the downside. If the breakout will be successful, it might get to 114.73. An important thing to remember is to wait how FOMC will decide and how the market is gonna react.
 

Attachments

  • usdjpy.png
    usdjpy.png
    681 KB · Views: 245
Paul Tudor Jones

Happy 64th Birthday to Paul Tudor Jones! If you don’t know him, he is one of the most successful traders of all time. He is also a hedge fund manager, investor and philanthropist.
 

Attachments

  • Paul Tudor Jones.png
    Paul Tudor Jones.png
    507.8 KB · Views: 215
USDCHF short setup

In the last few months, USDCHF has been showing a beautiful bear market, but it broke at the end of September and we can see the strong reversal where USDCHF went up around 240 pips in just 5 days. Around the marked area, we expect a correction (not a reversal) because of the area of resistances. If USDCHF gets to the marked area, the expected correction is around 50-100 pips.
 

Attachments

  • USDCHF analyza.png
    USDCHF analyza.png
    1,018.8 KB · Views: 220
Trading idea: NZDCHF short

NZDCHF is in a downtrend for almost half a year and it is giving us an opportunity to join that trend. The market has finally reached the resistance 0.6515 where it could turn downwards again. Moreover, divergence confirms the upcoming short on this currency pair and we also see a signal from our non-public set-ups.
 

Attachments

  • NZDCHF bez.png
    NZDCHF bez.png
    954.4 KB · Views: 214
Top