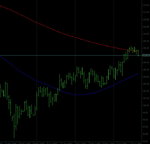
USD/JPY Golden Cross

DannyBly

Member
Messages
69
Likes
0
Although momentum has slowed down on the daily chart, the 50 and 200 SMA's appear poised to cross over with further movement to the upside (golden cross). We have resistance to the upside at 108.58 and support rising underneath with the up trendline that forms the bottom of the channel as shown on the chart. Looking for bullish follow through if the recent resistance at 108.58 can be violated and the 50 and 200 SMA's cross.

usdjpysun.jpg
 
Last edited by a moderator:
Although momentum has slowed down on the daily chart, the 50 and 200 SMA's appear poised to cross over with further movement to the upside (golden cross). We have resistance to the upside at 108.58 and support rising underneath with the up trendline that forms the bottom of the channel as shown on the chart. Looking for bullish follow through if the recent resistance at 108.58 can be violated and the 50 and 200 SMA's cross.

Analysis By TradersLog.com

Hmmmmm - I like the S/R stuff but essentially the golden cross is a lagging indicator crossing over an even more lagging indicator. Old meets older....kind of like Woody Allen f**king Susan Sarandon.... now there's an image for ya' :p

Ermmmm........ seriously, something's a bit funny here: I use Dailyfx.com free charts, and on there the 200 SMA is still above the price at around 108.12, and the recent rebound (ie the last 5 days' downward move) is off of the 200 SMA, the 50 SMA is below 105 and the golden cross is miles off yet.
Don't know whose charts are right....weird.... any others care to comment?

Nice support at 102 though :)

[Edit] - are your charts showing the weekend days as well? I can see some very 'illiquid' days on there. Mine only show Mon-Fri. Could that be it? I'd be interested to hear more about this, since I've never come across such a thing before.
 
Last edited:
No Cross here and without weekend bars

also this cross is for the very long term view :smart:

Capture.jpg
 
Top