The5ersTF
Active member
- Messages
- 231
- Likes
- 5
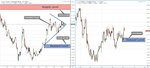
USD/CAD price performed a symmetrical triangle pattern on the Monthly chart.
The price range becomes very tight, it seems that very soon the price will have to pick a direction and to break the pattern.
It is very rare to find a triangle pattern on the monthly chart,
If the price will break the pattern toward up I'll look for a price action setup to buy USD/CAD .
If the price will break down the pattern I'll look for a price action setup to sell USD/CAD .
The demand below on the monthly chart is the target for the sell position,
The supply above is the target for the buy position.
The demand below on the daily chart is still inside the pattern and therefore it riskier to trade it, but it's still a level with potential
For good trade.
This is a long term analysis for the USD/CAD .