Hi everyone,
I'm new to trade2win and have a question about the strategybuilder in ProRealTime. I made a simple strategy as a test, and found something strange.
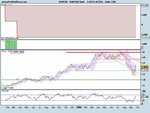
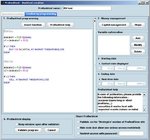
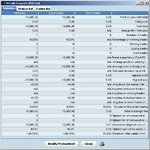
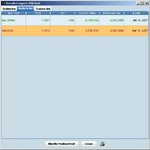
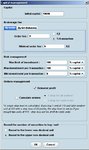
The strategy buys if RSI < 35 and sells if RSI > 65, and it had a trailing stop of 10%. When I tested it on stocks, I got the results that I expected, but I tried it on the EUR/USD Spot and the equity curve confused me.
If you look at the attachments, you can see for yourself. I think it has to do with the capital management settings, but I'm not sure what to change. BTW, the broker I plan to use has a spread of 1 pip on the EUR/USD (with a max of of 3 during periods of high volatility)
Can anyone help me? If I need to post anything else, just let me know. Or if I should post this anywhere else to get a faster reply, please let me know.
Thank you in advance!!
Best regards,
Jason
I'm new to trade2win and have a question about the strategybuilder in ProRealTime. I made a simple strategy as a test, and found something strange.
The strategy buys if RSI < 35 and sells if RSI > 65, and it had a trailing stop of 10%. When I tested it on stocks, I got the results that I expected, but I tried it on the EUR/USD Spot and the equity curve confused me.
If you look at the attachments, you can see for yourself. I think it has to do with the capital management settings, but I'm not sure what to change. BTW, the broker I plan to use has a spread of 1 pip on the EUR/USD (with a max of of 3 during periods of high volatility)
Can anyone help me? If I need to post anything else, just let me know. Or if I should post this anywhere else to get a faster reply, please let me know.
Thank you in advance!!
Best regards,
Jason