tradingdde
Junior member
- Messages
- 13
- Likes
- 1
Friday 6th was expected to be a busy day due to important news releases at 7.30 (central time).
As soon as the news released, the future loses 10 points in ... seconds , with no volumes, repeating similar yesterday same time pattern.
Who was in front of the monitor was likely to have had a feeling of "emptiness " as if all big investors had simultaneously shut down their monitors and "gone for a coffee together".
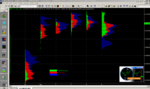
Buyers soon appear, and the strongest pre-opening session of the week in terms of volumes (green area in the chart) occurs.
The first hour of trading ( red area in the chart ) brings the price under yesterday's POC (1119-1120), then down again, breaking the previous low and ... the entire week value's area: that means really ... fear!
Then, some signals of inversion; a new volume area starts forming under the previous low (small blue bell in the chart) that could suggest a possible long entry in reversal.
After 3 hours of price congestion big investors come back from their coffe-break and started buying; price break out the congestion area and rally to the level they started the second downhill from : 1119-1120.
It seems that big investors have long coffe-breaks during important news releases, expecially when prices are too high for them.
Does it make sense?
As soon as the news released, the future loses 10 points in ... seconds , with no volumes, repeating similar yesterday same time pattern.
Who was in front of the monitor was likely to have had a feeling of "emptiness " as if all big investors had simultaneously shut down their monitors and "gone for a coffee together".
Buyers soon appear, and the strongest pre-opening session of the week in terms of volumes (green area in the chart) occurs.
The first hour of trading ( red area in the chart ) brings the price under yesterday's POC (1119-1120), then down again, breaking the previous low and ... the entire week value's area: that means really ... fear!
Then, some signals of inversion; a new volume area starts forming under the previous low (small blue bell in the chart) that could suggest a possible long entry in reversal.
After 3 hours of price congestion big investors come back from their coffe-break and started buying; price break out the congestion area and rally to the level they started the second downhill from : 1119-1120.
It seems that big investors have long coffe-breaks during important news releases, expecially when prices are too high for them.
Does it make sense?