Short-Term Watchlist 27.07.2025

Kripto Tolga

Newbie
Messages
8
Likes
0
Dear Investors,

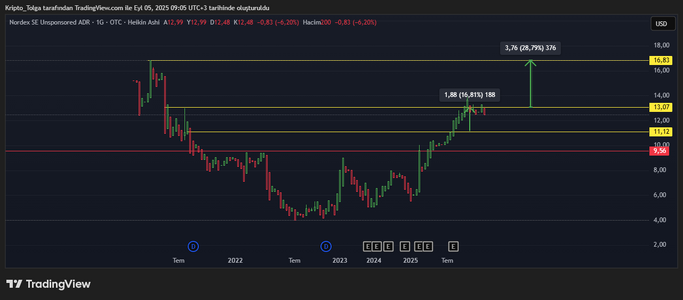
In the charts I shared:

  • Yellow lines represent resistance and target
  • Red indicates support lines and stopper levels
Good Luck!


1753568581911.png

1753568706281.png


1753568909247.png

1753569121751.png

1753569276230.png


1753569476679.png
 
Last edited by a moderator:
Thanks for sharing the charts—on your current list, which 1–2 tickers have the tightest stop/target ratio? I’m seeing your red zones line up with prior supply; curious where you’d invalidate.
 
Thanks for sharing the charts—on your current list, which 1–2 tickers have the tightest stop/target ratio? I’m seeing your red zones line up with prior supply; curious where you’d invalidate.

Thanks for sharing the charts—on your current list, which 1–2 tickers have the tightest stop/target ratio? I’m seeing your red zones line up with prior supply; curious where you’d invalidate.
"The red area is the stop zone, and the yellow lines represent resistance and targets... Entering a trade before the resistance is broken is risky."
 
Back
Top