scose-no-doubt
Veteren member
- Messages
- 4,630
- Likes
- 954
edited
*better to remain silent 😀
*better to remain silent 😀
Firstly, does it matter to you that the mkt only stays volatile for a short time at the moment you get a margin call and your broker forces you to liquidate your pairs trade at a monster loss? Point is that volatility is a killer for existing RV positions (for a whole variety of reasons). That is exactly what happened to a lot of funds in 07/08.Now, I'm completely lost 🙂
How is it short options when I buy 1000 shares in BP and short the same monetary amount in Shell?
If it's because volatility throws the pairs trade out if kilter then that's not necessarily true because the market doesn't stay volatile for that long. Perhaps 2007-8 and the flash crash are differing types. Long options could just as easily kill the trades off with spending money on options that expire worthless.
Firstly, does it matter to you that the mkt only stays volatile for a short time at the moment you get a margin call and your broker forces you to liquidate your pairs trade at a monster loss? Point is that volatility is a killer for existing RV positions (for a whole variety of reasons). That is exactly what happened to a lot of funds in 07/08.
Secondly, your point about being long options is smth I have already mentioned a few times.
Yes, exactly right... Volatility in 2008 was so hefty it would cause you margin calls on things you didn't think you owned. But you're right, if you're not leveraged, you can handle anything. The problem is that in 08, everyone was leveraged to the hilt.But how leverage does the account have to be before you get a margin call.
I'm sure this is something that can be simulated for 2008 or the flash crash but let's say you were only using 50% of the leverage available in the account.
That would have to be some pretty hefty volatility to cause a margin call on stocks that are closely correlated.
Yes, exactly right... Volatility in 2008 was so hefty it would cause you margin calls on things you didn't think you owned. But you're right, if you're not leveraged, you can handle anything. The problem is that in 08, everyone was leveraged to the hilt.
Well, you remember perhaps the most infamous recent pair trade? That time when Volkswagen became the biggest company in the whole world by market cap. Not quite the exact illustration of what I am talking about, but still...I suppose I have to model it really - see how far out of sync some of the pairs trades went.
Well, you remember perhaps the most infamous recent pair trade? That time when Volkswagen became the biggest company in the whole world by market cap. Not quite the exact illustration of what I am talking about, but still...
I don't know if there were any circuit breakers in the world of single stocks, but I ain't an expert.Is that even possible? How could it move that much in one day, don't the circuit breakers kick in at 10%?
I don't know if there were any circuit breakers in the world of single stocks, but I ain't an expert.
Well, you remember perhaps the most infamous recent pair trade? That time when Volkswagen became the biggest company in the whole world by market cap. Not quite the exact illustration of what I am talking about, but still...
Well, you have to assume that things of that sort of nature are mkt disruptions that occur during times of massive stress. So one way to protect is to just to be long vol, such as, for instance, far OTM strangles on the spooz. But you're definitely right in terms of just accepting it. You can only accept it, though, if you don't have this trade in killer size and are generally not too leveraged. The problem is that it just never works out like that.How exactly would you have protected against a surge like that in VW?
Presumably most hedges we talked about were against market crashes not a surge in a stock. Going long VIX options wouldn't help much either.
I'm still thinking that if you are pairs trading you have to accept this might happen occasionally and continuously pay yourself a dividend/amount from your account to prevent total loss. The account then just becomes the "bankroll".
Secondly, I can see how ratio charts are effective in pairs trades but is there any difference in using a regression chart? Aren't they just different ways of plotting the data?
Well, you have to assume that things of that sort of nature are mkt disruptions that occur during times of massive stress. So one way to protect is to just to be long vol, such as, for instance, far OTM strangles on the spooz. But you're definitely right in terms of just accepting it. You can only accept it, though, if you don't have this trade in killer size and are generally not too leveraged. The problem is that it just never works out like that.
I think cr responded on the regression stuff.
You're asking question that require uber quanty-ness.
Then it seems to me the safest way for a retail trader to play this is to treat the account as a bankroll.
Let's say you make 10% a month, then you should either withdraw that as a salary every month or if you are trying to build the account bigger then remove 2% of it and the rest goes to build the bankroll.
I think margin calls on IG are at around 100% of the account rather than most SB companies, which use 25% equity so it's a bit safer than most. Quite when they would action the margin call in a black swan event seems difficult.
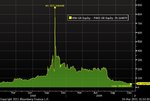
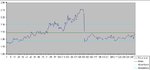
I've attached an example of BLAND and LAND during the crash 07 08 and you can see how it went out of sync by about double the amount of normal. You might have cut the trade at one point here so it wasn't all of a sudden even if it did return.
The May flash crash actually had little effect on this pairs trade, I haven't modelled any others at the moment but it seems the main risk would be big market sell offs like the dot com crash or 07/08 and you'd have time to bail out of most of them.
A VW type event would completely margin out your account.